This article will outline the use of the solariX MALDI FTMS for the preparation and imaging analysis of N-glycans from formalin-fixed paraffin embedded (FFPE) tissues.
N-glycosylation is a frequently occurring post translational modification comprising a carbohydrate moiety attached to the consensus sequence Asn-X-Ser/Thr, where X may be any amino acid residue other than proline, and a common modification of membrane related proteins.
N-glycans are synthesized and processed in the ER and Golgi via the actions of more than 300 enzymes that attach or trim sugar residues, which leads to thousands of varied structural combinations (1).
The great structural variety of N-glycans has a part in fine tuning protein structure and purpose. A number of cellular activities are reliant on N-glycosylation, including protein folding, protein targeting, regulation of protease activity, cell migration and cell-cell recognition (2, 3).
In the case of cancer, N-glycosylation has a vital function in the tumor microenvironment, mediating inflammatory and immune response, changing extracellular matrix production, and modulating cell surface receptor and stroma-tumor interactions.
N-glycosylation variations therefore act as key biomarkers and targets of therapy managing the development and advancement of cancer (4). Techniques applying MALDI imaging mass spectrometry to analyze the N-glycome from FFPE thin tissue sections have recently been reported (5, 6).
The workflow stemming from this is appropriate for analysis of the massive numbers of stored FFPE clinical samples, leading to novel studies in diagnosis and prognosis of cancer (7). While it is possible to achieve N-glycan imaging with any MALDI imaging mass spectrometry platform, there are a number of benefits specific to the solariX MALDI FTMS.
This article discusses high sensitivity mapping of the N-glycome as perceived from the complex tissue environment of an FFPE thyroid cancer sample.
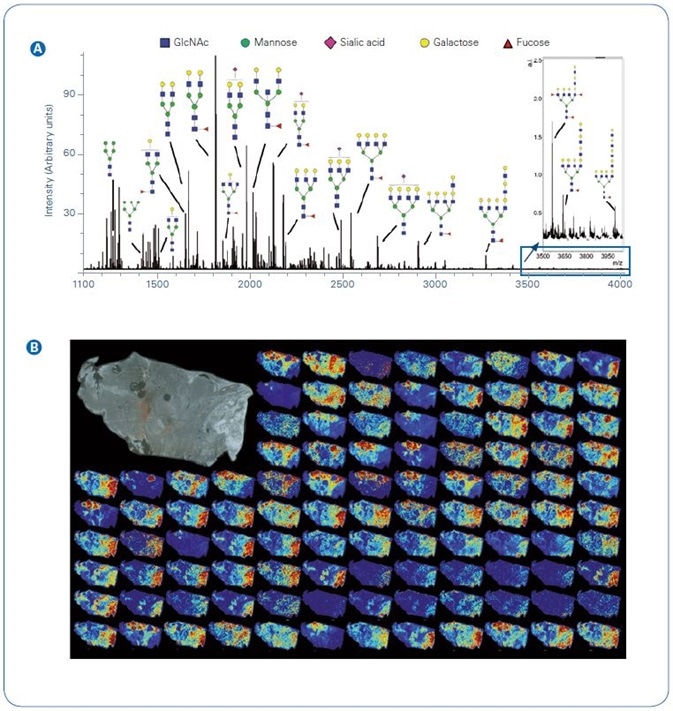
Figure 1. Example N-glycan signal from a single section of thyroid cancer.  Total average spectrum from the image with example glycoform structures per m/z;
  Tile view of example images. Inset top right, photomicrograph of unstained tissue prior to imaging. Abbreviations: GlcNAc, N-acetylglucosamine
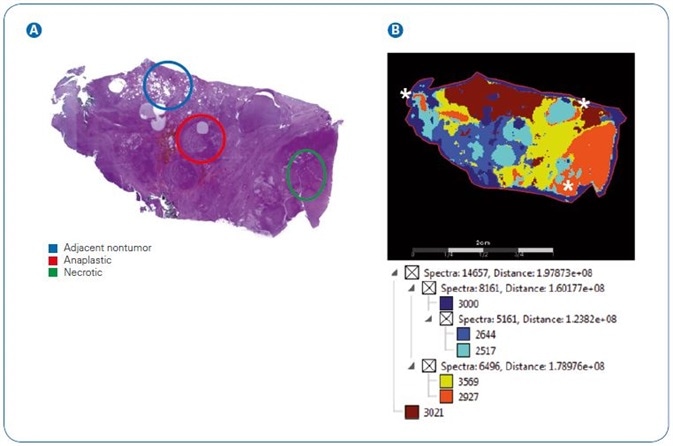
Figure 2. Image segmentation showing complexity of N-glycan signatures in a thyroid cancer tissue section. Pathologist marked H&E stain of section highlighting adjacent nontumor, anaplastic, and necrotic regions. SCiLS image segmentation of N-glycans from 2D mapping. White asterisks mark calculated overlaps of anaplastic and necrotic regions.
Methods
Detailed description of the processes for releasing N-glycans from FFPE tissue has been provided (5). An Institutional Review Board gave approval for the use of de-identified tissue specimens to be disposed of.
In short, a 5 µm thick FFPE tissue segment of thyroid cancer was incubated for 60 minutes at 60 °C, dewaxed, and antigen retrieved under acidic conditions (10 mM citraconic buffer, pH 3).
A robotic sprayer (TM-Sprayer™, HTXImaging) was engaged to apply the enzyme and matrix across distinct stages. To begin with, recombinant PNGase F (Mehta Lab, Medical University of South Carolina) was dispersed onto tissue at 0.1 µg/µL. Next, the sample was incubated in a closed cell culture dish at 37 °C under high humidity for 120 minutes.
Following this, α-cyano-4-hydroxycinnamic acid (CHCA) was dispersed onto tissue at 7 mg/mL in 50% acetonitrile, 0.1% trifluoroacetic acid. A 7 T solariX, furnished with a dual ESI/MALDI ion source and a Smartbeam II laser set to minimum focus, was used to carry out MALDI imaging analysis in positive ion mode.
All in all, 200 laser shots were gathered at each pixel, with a spacing of 150 µm between each pixel. Broadband mode, spanning m/z 500-5,000, with a transient length of 1.2 seconds, was used to acquire the images, resulting in an on-tissue resolving power of around 85,000 at m/z 1,850.
To yield a peak list connected to 2D tissue maps, FlexImaging software version 4.1 was employed. GlycoWorkbench 2.0 was used to putatively identify N-glycans based on accurate mass within 5 ppm. (8)
The 2D data and peak details were uploaded to SCiLS Lab software (2016b, Version 4.01.8705, Bruker Daltonics) for examination between pathologist-marked tumor and non-tumor areas.
The SCiLS parameters of weak denoising, bisecting K-means, and the Manhattan metric were employed for segmentation of images. N-glycans which had been changed were filtered by Wilcoxon rank sum hypothesis testing p value ≤1.0E-3 and area under the receiver operating curve ≤0.8.
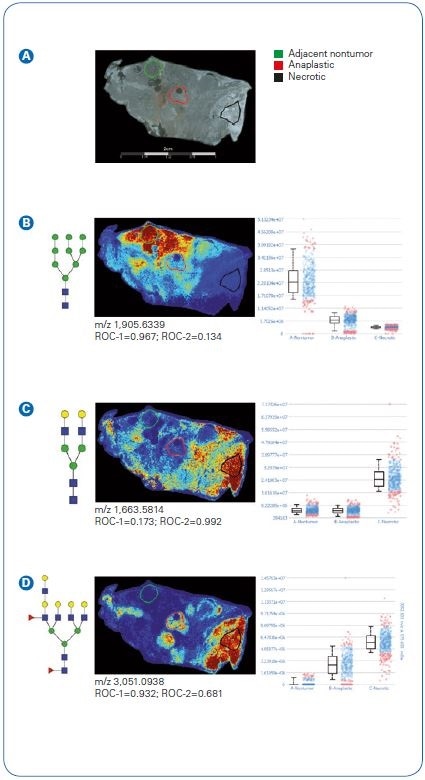
Figure 3. Quantification of N-glycan signatures from regional areas on tissue. Statistical testing was done comparing nontumor adjacent and anaplastic regions (ROC-1) or anaplastic versus necrotic (ROC-2). Photomicrograph depicting areas selected for measuring relative abundance of N-glycan expression. A high mannose (Man9) structure distinguishing nontumor adjacent compared to anaplastic tumor or necrotic regions.  A biantennary N-glycan defining necrotic regions with low expression in nontumor adjacent and anaplastic.
  A tetrantennary fucosylated structure with low expression in adjacent nontumor and increasing expression in anaplastic and necrotic tissues regions.
Results and Discussion
This study showcases N-glycan imaging analysis using a tissue section which contains anaplastic thyroid cancer. Thyroid cancer is the most frequently occurring malignancy of the endocrine system.
The majority of thyroid cancers stay constant and indolent, meaning patients experience positive results when undergoing surgical resection or therapies aimed at preventing growth promoting kinases and angiogenesis (9).
The rarest and most lethal form of thyroid cancer is the anaplastic thyroid tumor, which claims the life of most patients within twelve months. An absence of effective treatments leads to a poor outlook for patents, and in order to work towards treatments that halt the progression of tumors, novel molecular information is required.
The sample tissue portion of an anaplastic thyroid cancer was prepared according to Bruker’s conventional protocol for N-glycan release and was studied using MALDI FTMS with a 7.0 Tesla solariX.
Overall ion current and instances of 2D N-glycans mapped across the tissue can be seen in Figure 1. The ability to detect N-glycans is wholly reliant on the activity of the applied PNGase F.
Here, more than 111 N-glycans were identified as [M+Na]+ or [M-H+2Na]+, including high mannose, complex, hybrid, and sialylated structures. It is vital to remember that sialic acids are thermally labile and the majority of MALDI sources lead to loss of the sialic acid from the N-glycan.
The solariX was explicitly developed to keep loss of sialic acids to a minimum with the help of high pressure collisional cooling gas (10). Subsequently, sialylated N-glycans are identified with equal intensity to N-glycans not containing this labile residue (Figure 1A).
A further benefit of the solariX is that the source is separated from the mass measurement, allowing tissues mounted on standard microscope slides to be studied with only a minor loss of mass resolution or mass accuracy.
In this case, the joint workflow and imaging platform afford high sensitivity detection of a wide m/z range of N-glycans, covering everything from small pentamannose structures (Man5, m/z 1,257.4226) to fucosylated tetraantennary species with extended poly-N-acetyllactosamine (polyLacNAc) series (m/z 4,000.4325).
All in all, the N-glycan imaging workflow delivers powerful and complete N-glycan signatures from FFPE tissue. More general observations have noted that the study of advanced tumors (such as those in this example) have N-glycan signatures that permit mapping of significantly more than 100 N-glycan species.
In order to analyze the imaged tissue against the pathologist marked tissue, SCiLS image segmentation was employed. The pathologist-marked hematoxylin and eosin stain of the thyroid tissue, with areas marked as adjacent non-tumor, necrotic or anaplastic tumor can be seen in Figure 2.
To offer corresponding numbers of spectra per area, sections were manually stretched out. The contrast of pathologist-marked sections against SCiLS segmentation makes the intricacy of the tumor environment clear.
To be precise, sections match to pathologist markings of normal adjacent (dark red) and necrotic (orange), but display greater development of anaplastic tumor areas (aqua).
On the other hand, N-glycan signatures mapping to the anaplastic area spread into the necrotic areas with low levels of scattering close to adjacent non-tumor tissue. This data makes clear that N-glycan signatures relate to distinctive tissue pathologies.
To analyze quantitative measurement of N-glycans (Figure 3), tissue segments were chosen from the pathologist-marked segments. Segments were chosen from within the pathologist-marked sections for adjacent non-tumor, necrotic, and anaplastic tumor.
An example can be seen of a high mannose structure (Man9) mapped to nonadjacent tissue areas with a ~ fourfold surge based on median value in comparison to anaplastic tumor areas.
Necrotic regions demonstrated distinctive signatures, aside from both nonadjacent tumor and anaplastic tumor, and can be seen here with an example biantennary structure.
Curiously, N-glycans detected in anaplastic tumor areas were also commonly encountered in pathologist-marked necrotic areas (see also Figure 1 B).
These examples demonstrate that N-glycan expression is distinctively structured within the tumor micro-environment, and these variations may be identified with the solariX MALDI FTMS imaging platform.
Conclusions
The N-glycan imaging workflow uncovers complex carbohydrate interactions occurring within FFPE tumor tissues. The use of the solariX, as demonstrated here, is a vital constituent of the imaging workflow.
The cooled source allows for the capture of biologically significant but labile carbohydrate moieties, sialic acids that would otherwise be absent from MALDI analysis.
High sensitivity permits discovery over an extensive variety of N-glycan structures. Study of this one piece of tissue segment makes clear the many distinctive N-glycosylation alterations that can take place in anaplastic thyroid cancer.
This workflow offers a highly useful means through which to engage in more detailed investigations into the molecular causes of disease, and can be applied to any FFPE tissue.
References
- Moremen KW, Tiemeyer M, Nairn AV. 2012. Nature Reviews Molecular Cell Biology 13: 448-62
- Stanley P, Schachter H, Taniguchi N. 2009. Chapter 8: N-Glycans. In Essentials of Glycobiology, ed. A Varki, RD Cummings, JD Esko, HH Freeze, P Stanley, et al. Cold Spring Harbor (NY): Cold Spring Harbor Laboratory Press
- Varki A. 2017. Glycobiology 27: 3-49
- Pinho SS, Reis CA. 2015. Nature Reviews Cancer 15: 540-55
- Powers TW, Neely BA, Shao Y, Tang H, Troyer DA, et al. 2014. PLoS One 9: e106255, pp1-11. PMID: 25184632
- Drake RR, Powers TW, Jones EE, Bruner E, Mehta AS, Angel PM. 2017. Advances in Cancer Research 134: 85-116
- Gorzolka K, Walch A. 2014. Histology and Histopathology 29: 1365-76
- Ceroni A, Maass K, Geyer H, Geyer R, Dell A, Haslam SM. 2008. Journal of Proteome Research 7: 1650-9
- Lin R-Y. 2011. Nature Reviews Endocrinology 7: 609-16
- O’Connor PB, Mirgorodskaya E, Costello CE. 2002. Journal of the American Society for Mass Spectrometry 13: 402-7
About Bruker Daltonics
Empowering Science – Improving Life
Bruker Daltonics delivers cutting-edge mass spectrometry solutions and workflows that help scientists and industry leaders tackle real-world challenges and make new discoveries. From life sciences and pharmaceutical research to food and contaminant analysis, environmental monitoring, forensics, and industrial quality control, our technologies and instruments provide the precision and reliability you need to make confident decisions.
Our innovative platforms - such as timsTOF, scimaX, neofleX, and DART-TQ - combined with advanced software like SCiLS™ Lab, MetaboScape®, and Biopharma Compass®, transform complex data into actionable insights. Breakthrough innovations like Trapped Ion Mobility (TIMS), Omnitrap®, and dual ionization GC-HRMS are redefining what’s possible in mass spectrometry.
Trusted by leading research institutes, universities, government agencies, and industrial partners worldwide, Bruker Daltonics is committed to driving scientific progress and delivering solutions that matter.
(For Research Use Only. Not for use in clinical diagnostic procedures).
Sponsored Content Policy: News-Medical.net publishes articles and related content that may be derived from sources where we have existing commercial relationships, provided such content adds value to the core editorial ethos of News-Medical.net, which is to educate and inform site visitors interested in medical research, science, medical devices and treatments.