Polychlorinated Biphenyls (PCBs) include a group of chlorinated compounds with over 200 variations, or congeners, with distinct chemical and physical characteristics. PCBs can be released into the general environment through many sources. For example, by illegal or improper dumping of PCB wastes, such as transformer fluids, from poorly maintained toxic waste sites, by disposal of PCB-containing consumer products in municipal landfills, and through leaks or fugitive emissions from electrical transformers whose oil often contains PCBs.
Chronic exposure of PCBs to animals can result in hormone balance disruptions, cancer, or reproductive failures. A key source of human PCB exposure can be foods, usually from fish and animal fat (Table 1). PCBs are lipophilic, and they preferentially separate from water and adsorb onto sediment at the lake and river beds. Bottom feeders and other aquatic organisms subsequently consume and accumulate PCBs, leading to a bio-concentration effect, which moves upward in the food chain.
Table 1. Maximum level for the sum of the six targeted PCBs and limit of quantitation per congener in seafood.
| Foodstuff |
Maximum level |
Limit of Quantitation |
| Sum of PCB 28, 52, 101, 138, 153, 180 |
| Muscle meat of fish, shellfish, and products thereof |
75 ng/g wet weight |
1 ng/g per congener |
The European Commission Regulations EU 252/2012[1] and 1259/2011[2] classify PCBs into dioxin-like (DL-PCB) and non-dioxin-like PCBs (NDL-PCB) on the basis of their structural characteristics and toxicity, thus resulting in various technologies and maximum levels for these two groups. The technique described in this article includes six marker NDL-PCBs: PCB 28, 52, 101, 138, 153, and 180.
These PCBs constitute around half of the total amount of NDL-PCBs found in foodstuffs, and their sum is regarded as an ideal marker for occurrence and human exposure to NDL-PCBs and is thus set as the maximum level.[2] Performance standards for analysis of NDL-PCBs by GC-MS/MS are elaborated within the EU 589/2014 regulations.[4]
Polycyclic aromatic hydrocarbons (PAHs) are powerful atmospheric pollutants and are of concern since some have been identified as mutagenic, carcinogenic, or teratogenic. Just like PCBs, PAHs are lipophilic and usually have a very poor aqueous solubility. Thus, they can build up in lipid tissues of animals and plants. PAHs present in air (by deposition), soil (by transfer), or water (deposition and transfer) can contaminate foods. Some PAHs are semi-volatile; however, the majority of them tend to adsorb on organic particulate matter. Heavier PAHs preferably combine with particulate matter; therefore, a major route of contamination is atmospheric fallout. When particulates fall out onto a water surface, they are transported in suspension, ultimately ending up in freshwater or marine sediments.
PAHs form a strong adherence with these sediments, efficiently developing a potential pollution reservoir for subsequent PAH emission. Sediment-dwelling and filtering organisms are the most vulnerable to contamination. A majority of the organisms have a high bio-transformation capacity for PAHs; thus, there is no important bio-magnification in the aquatic food chain. However, filter-feeding bivalves, such as mussels and oysters, may accumulate PAHs since they filter large volumes of water and have a low metabolic potential for these compounds.
Until 2008, benzo(a)pyrene was employed as a marker for the occurrence of PAHs in foods. However, in 2008, the Scientific Panel on Contaminants in the Food Chain of the European Food Safety Authority (EFSA) inferred that benzo(a)pyrene alone was not an ideal marker for the occurrence of PAHs in foods and that a system of four specific substances (benzo(a)anthracene, benzo(a) pyrene, benzo(b) fluoranthene, and chrysene) would be more ideal markers.[4] As a result, Commission Regulation EU 835/2011[5] amended Regulation (EC) 1881/2006 in order to set maximum levels in particular foodstuffs for the sum of these four PAHs, while Commission Regulation EU 836/2011[6] set their LODs and limits of quantitation (LOQs), as represented in Table 2.
Table 2. Maximum levels for benzo(a)pyrene and the sum of the four PAHs and limits of detection and quantitation.
| Foodstuff |
Maximum level (μg/kg) |
Limit of Detection |
Limit of Quantitation |
| Benzo(a) pyrene |
Sum of 4 PAHs |
| Smoked sprats and canned smoked sprats, bivalve mollusks (fresh, chilled or frozen), heat treated meat and heat treated meat products sold to the final consumer |
5.0 |
30.0 |
≤ 0.30 μg/kg for each of the four substances |
≤ 0.0 μg/kg for each of the four sub-stances |
| Bivalve mollusks (smoked) |
6.0 |
35.0 |
A technique has been devised for the concurrent analysis of the six markers NDL-PCBs and 16 PAHs (including the four specifically regulated PAHs) in bivalve mollusk samples with the help of the Bruker EVOQ GC-TQ Premium MS/MS system.
Experiment
Sample Preparation
Mussel and clam samples were gathered from the southern coast of Spain. Samples (8 g) were hydrolyzed with MeOH and KOH, filtered, and then extracted with n-hexane. The extracts were loaded into a cartridge containing alumina and florisil[7–9] in order to purify them. The purified extracts were evaporated to dryness under a nitrogen stream and reconstituted in 2 mL of cyclohexane:toluene (9:1). The sample preparation workflow is illustrated in Figure 1.
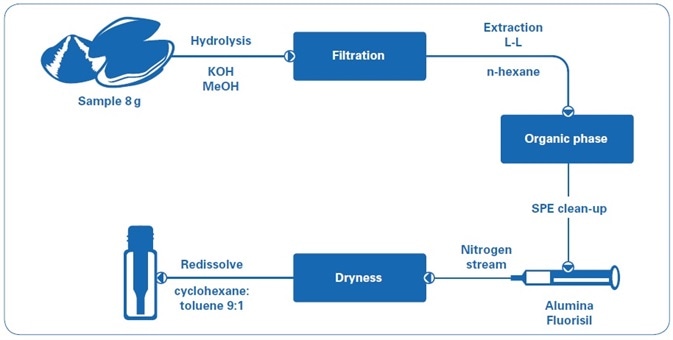 Figure 1. Sample preparation workflow.
PCB and PAH standards were collected from Dr Ehrenstorfer GmbH (Augsburg, Germany) and spiked samples were prepared.
Table 3. Mass spectrometry method conditions
| Mass Spectrometer |
Bruker EVOQ GC-TQ MS system |
| MS Conditions |
| Ionization |
EI, 70 eV |
| Emission Current |
40 μA |
| Active Focusing Q0 |
135 °C with Helium |
| Transfer Line Temperature |
300 °C |
| Source Temperature |
300 °C |
| CID Gas |
Ar, 2.0 mTorr |
| Detector Mode |
EDR |
| Scan Mode |
MRM, 0.6 sec/scan |
| Gas Chromatograph |
Bruker 436 GC |
| GC Conditions |
| Injector |
1177 Split/splitless |
| Sample Volume/Injection Mode |
1 μL, splitless |
| Injector Insert |
4 mm single taper splitless with deact. wool (p/n: SG092003) |
| GC Oven Temperature |
70 °C (1.7 min)→ 30 °C/min→ 180 °C (0´)→ 5 °C/min→ 320 °C (17´) |
| GC Column |
Bruker BR-PCB, 40 m x 0.18 mm, 0.18 micron (p/n: BR58697) |
| Carrier Gas |
Helium, 0.8 mL/min constant flow |
| Total Run Time |
50 min |
| Autosampler |
Bruker 8400 autosampler |
| Software |
Bruker MSWS 8.2.1/TASQ 1.4 processing software |
Methodology
In total, 41 compounds were analyzed which includes 16 PAHs, 16 deuterated PAHs used as internal standards (IS) and 9 PCBs.
Up to three MRM transitions per compound were employed wherever possible in order to increase specificity. Table 4 gives a complete list of MRM transitions.
Table 4. MRM conditions for the PCBs and PAHs monitored
| Compound Name |
RT (min.) |
Precursor Ion |
Quan Ion |
CE |
Confirm Ion 1 |
CE |
Confirm Ion 2 |
CE |
| Naphthalene-d8 |
6.61 |
136 |
134 |
|
132 |
-25 |
- |
- |
| Naphthalene |
6.70 |
128 |
102 |
|
126 |
-20 |
127 |
-5 |
| Acenaphthalene-d8 |
10.75 |
160 |
158 |
|
156 |
-25 |
- |
- |
| Acenaphthalene |
10.80 |
152 |
150 |
|
151 |
-15 |
126 |
-28 |
| Acenaphthene-d10 |
11.14 |
164 |
160 |
|
162 |
-18 |
- |
- |
| Acenaphthene |
11.24 |
153 |
127 |
|
151 |
-25 |
152 |
-20 |
| Fluorene-d10 |
12.84 |
174 |
172 |
|
170 |
-30 |
- |
- |
| Fluorene |
12.95 |
165 |
164 |
|
163 |
-30 |
139 |
-30 |
| Phenanthrene-d10 |
16.67 |
188 |
184 |
|
186 |
-20 |
- |
- |
| Phenanthrene |
16.79 |
178 |
176 |
|
177 |
-10 |
152 |
-25 |
| Anthracene-d10 |
16.98 |
188 |
184 |
|
186 |
-20 |
- |
- |
| Anthracene |
17.08 |
178 |
176 |
|
152 |
-25 |
177 |
-10 |
| PCB-28 |
15.30 |
256 |
186 |
|
151 |
-50 |
- |
- |
| PCB-30 |
18.01 |
256 |
186 |
|
151 |
-50 |
- |
- |
| PCB-52 |
18.94 |
292 |
222 |
|
257 |
-15 |
- |
- |
| PCB-101 |
22.21 |
326 |
256 |
|
291 |
-15 |
- |
- |
| Fluoranthene-d10 |
22.34 |
212 |
208 |
|
210 |
-15 |
- |
- |
| Fluoranthene |
22.44 |
202 |
200 |
|
201 |
-15 |
152 |
-32 |
| Pyrene-d10 |
23.53 |
212 |
208 |
|
210 |
-15 |
- |
- |
| Pyrene |
23.63 |
202 |
200 |
|
201 |
-15 |
151 |
-45 |
| PCB-153 |
25.43 |
360 |
290 |
|
325 |
-15 |
- |
- |
| PCB-138 |
26.61 |
360 |
290 |
|
325 |
-15 |
- |
- |
| PCB-183 |
27.11 |
394 |
324 |
|
359 |
-15 |
- |
- |
| PCB-180 |
29.04 |
394 |
324 |
|
359 |
-15 |
- |
- |
| Benzo(a)anthracene-d12 |
29.60 |
240 |
236 |
|
238 |
-20 |
- |
- |
| Benzo(a)anthracene |
29.73 |
228 |
226 |
|
202 |
-30 |
227 |
-18 |
| Chrysene-d12 |
29.82 |
240 |
236 |
|
238 |
-20 |
- |
- |
| Chrysene |
29.96 |
228 |
226 |
|
202 |
-25 |
227 |
-18 |
| PCB-170 |
30.22 |
394 |
324 |
32 |
359 |
-15 |
- |
- |
| Benzo(b)fluoranthene-d12 |
35.06 |
264 |
260 |
|
262 |
-30 |
- |
- |
| Benzo(b)fluoranthene |
35.21 |
252 |
250 |
|
248 |
-60 |
224 |
-55 |
| Benzo(k)fluoranthene-d12 |
35.16 |
264 |
260 |
|
262 |
-30 |
- |
- |
| Benzo(k)fluoranthene |
35.30 |
252 |
250 |
|
248 |
-60 |
224 |
-55 |
| Benzo(a)pyrene-d12 |
37.06 |
264 |
260 |
|
262 |
-30 |
- |
- |
| Benzo(a)pyrene |
37.24 |
252 |
250 |
|
248 |
-60 |
224 |
-55 |
| Dibenzo(a,h)anthracene-d14 |
45.10 |
292 |
288 |
|
290 |
-20 |
- |
- |
| Dibenzo(a,h)anthracene |
45.50 |
278 |
276 |
|
250 |
-50 |
277 |
-20 |
| Indene(1,2,3-c,d)pyrene-d12 |
45.45 |
288 |
284 |
|
286 |
-20 |
- |
- |
| Indene(1,2,3-c,d)pyrene |
45.75 |
276 |
272 |
|
273 |
-45 |
274 |
-40 |
| Benzo(g,h,i)perylene-d12 |
48.16 |
288 |
286 |
|
284 |
-40 |
| Benzo(g,h,i)perylene |
48.47 |
276 |
272 |
|
273 |
-45 |
274 |
-40 |
Results and Discussion
The procedures and analytical demands within the EU[1–6] to monitor the levels of PAHs and NDL-PCBs in foodstuffs are very stringent and must conform to performance criteria with regards to linearity, accuracy, and precision, among other criteria. As per the provisions of the EU regulations, laboratories shall be accredited following the ISO 17025 standard by a standard body operating according to ISO Guide 58 to guarantee the analytical quality assurance. The results demonstrated below include all the analytical quality criteria demanded by the European regulations.
GC Separation
The GC operating conditions were optimized to achieve an optimal peak shape without any tailing effects, specifically for the late eluting PAHs as demonstrated in Figure 2. Furthermore, this optimized separation offered high sensitivity.
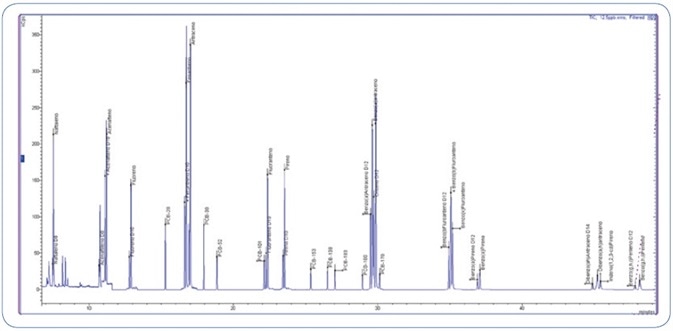
Figure 2. Total Ion Chromatogram (TIC) of 12.5 ppb standard mix (PAHs and PCBs).
An exceptional chromatographic separation for the more critical pairs of compounds (as shown in Figure 3) could be obtained with the help of a narrow bore capillary column (40 m x 0.18 mm), thereby eliminating peak co-elution that could potentially mask some peaks and yield erroneous outcomes.
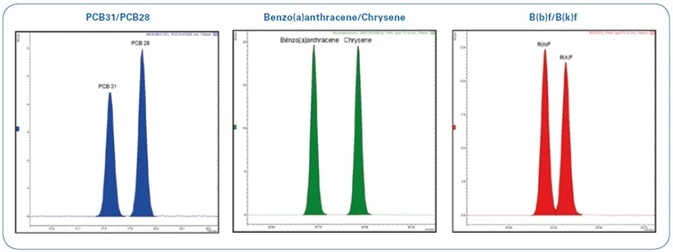
Figure 3. Total Ion Chromatogram (TIC) of 12.5 ppb standard mix (PAHs and PCBs) expanded in indicated areas.
Linearity
The linearity of response of this technique has been assessed from the reporting limits upward. Nine various solutions of increasing concentrations were made: 0.5 ppb, 1 ppb, 2.5 ppb, 5 ppb, 12.5 ppb, 25 ppb, 50 ppb, 75 ppb, and 100 ppb, and spiked with the same amount of deuterated standards. Each standard solution was examined in triplicate.
Figures 4 and 5 show selected calibration curves for PAHs and PCBs, respectively.
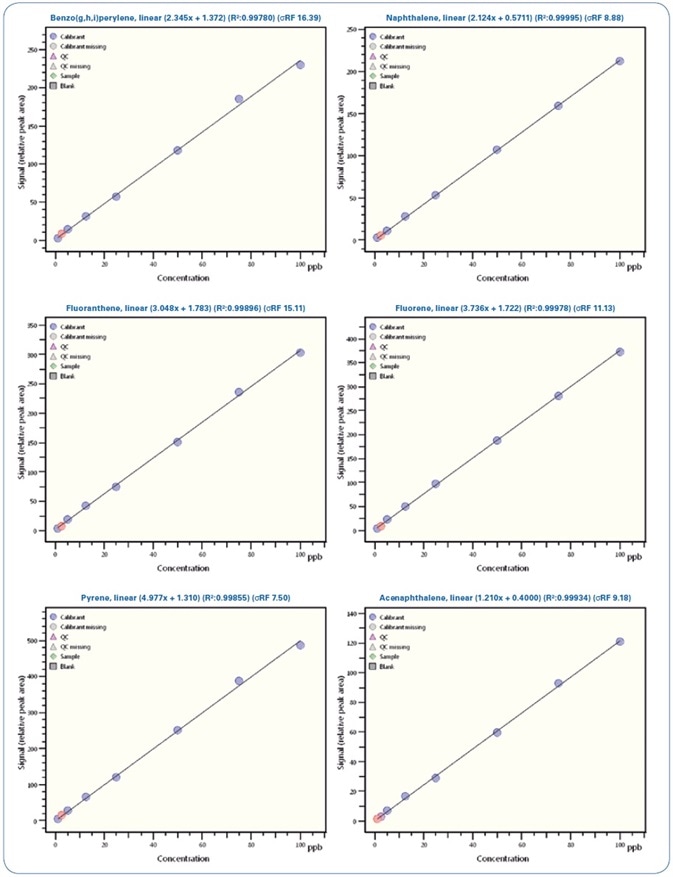
Figure 4. Calibration curves for selected PAHs from 0.5 ppb to 100 ppb.
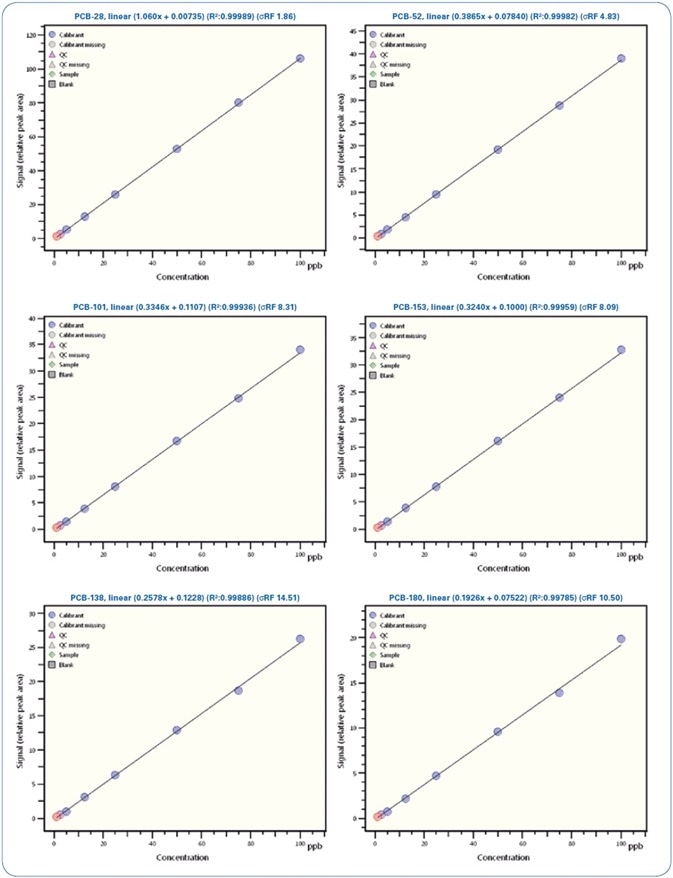
Figure 5. Calibration curves for selected PCBs from 0.5 ppb to 100 ppb
Illustrated in Table 5 is a review of the calibration results demonstrating the linearity of the method with regression coefficients R2 > 0.995 and relative standard deviation (RSD)
Table 5. Summary of calibration results, with nine calibration levels from 0.5 to 100 ppb
| Compound name |
R² |
RSD (%) |
Compound name |
R² |
RSD (%) |
| Naphthalene |
0.99995 |
8.88 |
PCB-138 |
0.99886 |
14.51 |
| Acenaphthalene |
0.99934 |
9.18 |
PCB-183 |
0.99558 |
14.51 |
| Acenaphthene |
0.99620 |
11.42 |
PCB-180 |
0.99785 |
10.50 |
| Fluorene |
0.99978 |
11.13 |
Benzo(a)anthracene |
0.99956 |
12.7 |
| Phenanthrene |
0.99886 |
6.32 |
Chrysene |
0.99959 |
12.06 |
| Anthracene |
0.99845 |
12.03 |
PCB-170 |
0.99613 |
14.94 |
| PCB-28 |
0.99989 |
1.86 |
Benzo(b)fluoranthene |
0.99854 |
7.90 |
| PCB-30 |
0.99931 |
8.57 |
Benzo(k)fluoranthene |
0.99674 |
11.12 |
| PCB-52 |
0.99982 |
4.83 |
Benzo(a)pyrene |
0.99721 |
13.78 |
| PCB-101 |
0.99936 |
8.31 |
Dibenzo(a,h)anthracene |
0.99613 |
14.40 |
| Fluoranthene |
0.99896 |
15.11 |
Indene(1,2,3-c,d)pyrene |
0.99752 |
12.88 |
| Pyrene |
0.99855 |
7.50 |
Benzo(g,h,i)perylene |
0.99780 |
16.39 |
| PCB-153 |
0.99959 |
8.09 |
- |
- |
- |
Sensitivity and Detection Limits
One standard solution with a concentration of 0.1 ppb (100 femtogram on-column) was injected three times in order to validate the sensitivity of the method. Signal-to-noise (S/N) ratio above 40 was obtained for all compounds and replicates. Thus, the LOD for all analytes is less than 0.1 ppb.
Figures 6 and 7 show the MRM chromatograms for selected PAHs and PCBs, respectively.
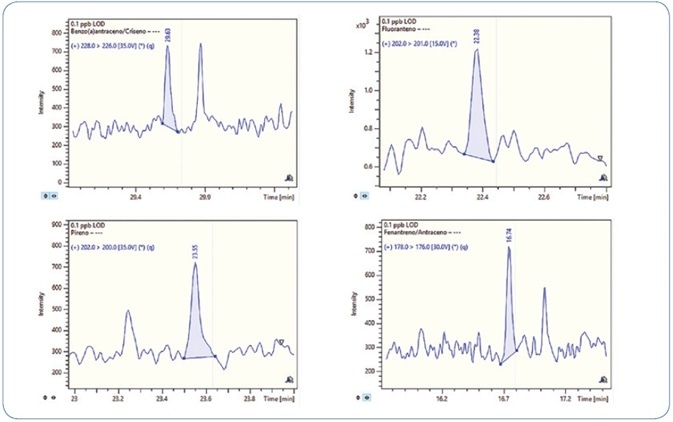
Figure 6. MRM chromatograms for selected PAHs at 0.1 ppb level (100 femtogram on-column).
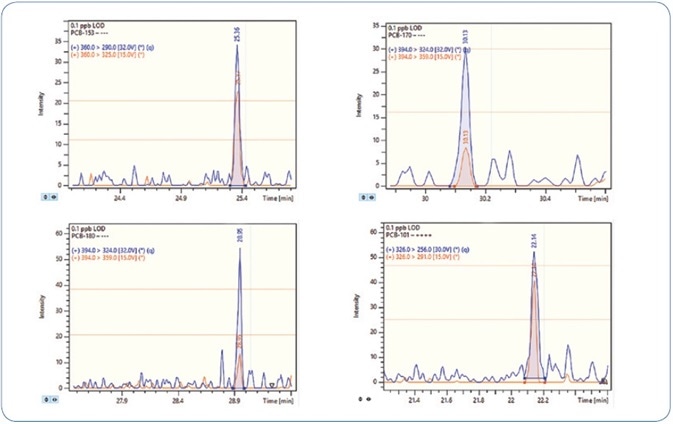
Figure 7. MRM chromatograms for selected PCBs at 0.1 ppb level (100 femtogram on-column).
Precision and Repeatability
The precision, expressed as repeatability, was estimated on the results obtained from three replicate analyses of a mussel extract spiked with PAHs and PCBs at 0.8 µg/kg. It is to be noted that this level is somewhat below the LOQ (0.9 µg/kg) needed for PAHs (as shown in Table 2).
Figure 8 shows an example of repeatability for chosen PAHs and PCBs.
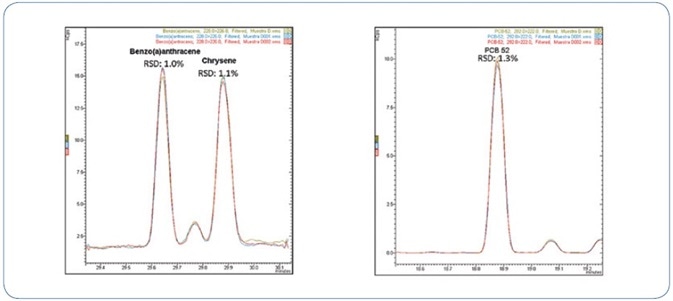
Figure 8. Three replicate injections of a mussel extract spiked with 0.8 µg/kg of PAHs and PCBs.
Outstanding relative standard deviation of less than 4% was obtained for all analytes in mussel extract spiked at 0.8 µg/kg, as represented in Table 6.
Table 6. Summary of area repeatability for selected PCBs and PAHs in a mussel extract spiked at 0.8 µg/kg
| Compound name |
Replicate 1 (Area) |
Replicate 2 (Area) |
Replicate 3 (Area) |
Average (Area) |
RSD (%) |
| Acenaphthene |
50042 |
50822 |
50083 |
50316 |
0.7 |
| Acenaphthalene |
10673 |
10596 |
10669 |
10646 |
0.3 |
| Anthracene |
44029 |
43066 |
43873 |
43656 |
1.0 |
| Benzo(a)pyrene |
23148 |
23450 |
23986 |
23528 |
1.5 |
| Benzo(a)anthracene |
43193 |
43780 |
44175 |
43716 |
0.9 |
| Benzo(b)fluoranthene |
261459 |
266883 |
261520 |
263287 |
1.0 |
| Benzo(g,h,i)perylene |
12876 |
12977 |
13155 |
13003 |
0.9 |
| Benzo(k)fluoranthene |
29562 |
29539 |
29145 |
29415 |
0.7 |
| Chrysene |
42581 |
43704 |
43343 |
43209 |
1.1 |
| Dibenzo(ah)anthracene |
13906 |
13937 |
14000 |
13948 |
0.3 |
| Phenanthrene |
47378 |
46220 |
47637 |
47078 |
1.3 |
| Fluoranthene |
46342 |
45928 |
45007 |
45759 |
1.2 |
| Fluorene |
41185 |
40994 |
42628 |
41602 |
1.8 |
| Indene(1,2,3-c,d)pyrene |
11494 |
11184 |
11072 |
11250 |
1.6 |
| Naphthalene |
21826 |
22009 |
22823 |
22219 |
2.0 |
| PCB 101 |
53189 |
49522 |
53118 |
51943 |
3.3 |
| PCB 138 |
40578 |
40392 |
40627 |
40532 |
0.2 |
| PCB 153 |
141830 |
137724 |
135958 |
138504 |
1.8 |
| PCB 180 |
47887 |
46108 |
47638 |
47211 |
1.7 |
| PCB 28 |
33700 |
33934 |
32112 |
33249 |
2.4 |
| PCB 52 |
32109 |
31240 |
31233 |
31527 |
1.3 |
| Pyrene |
74599 |
73822 |
73394 |
73938 |
0.7 |
Selectivity, Ion Ratios Stability, and Robustness
The response of analytes in spiked mussel samples was compared with those of spiked standards to test the selectivity. This study did not find any interferences or co-elution effects. Also, there was no deviation in retention times between samples and standard chromatograms. Stability of the ion ratio is also essential for an unequivocal identification when using triple quadrupole instruments, since it helps to avoid any false positive reporting.
A comparison of pyrene analysis in a wedge clam extract and standard solution is illustrated in Figure 9. The relative retention time (RRT) difference for pyrene in wedge clam extract and standard is −0.03%, while the tolerance permitted is ±0.25%.[4] For confirmation ion 1, the ion ratios difference is 1.1% and accepted tolerance is ±20%, and for confirmation ion 2, the ion ratios difference is 7.8% and accepted tolerance is ±50%.[4]
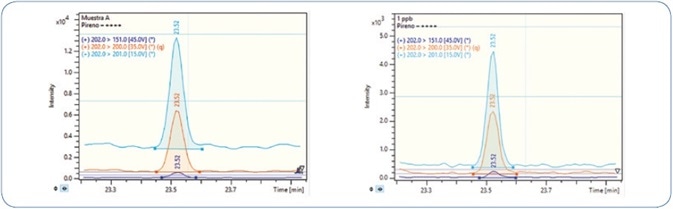
Figure 9. Analysis of a wedge clam extract (left) in comparison to a pyrene standard solution (right). Orange: Quantitation ion; Sky Blue: Confirmation ion 1; Dark Blue: Confirmation ion 2.
The robustness of the technique was confirmed by analyzing replicates of bivalve mollusks spiked with PAHs and PCBs; in particular, wedge and hard clams (referred to as berberechos and almejas respectively, in Spain). Wedge clam extracts spiked at 0.8 µg/kg with PAHs and PCBs are shown in Figures 10 and 11, respectively. As represented, all analytes are perfectly identified, exhibiting exceptional response for the quantitation ion, as well as the confirmation ions for an unequivocal identification, thereby avoiding any false positive identification and reporting. Reducing the amount of matrix content injected is an important criterion for evaluation, as it usually results in a decrease in the maintenance needed to maintain robustness and sensitivity.
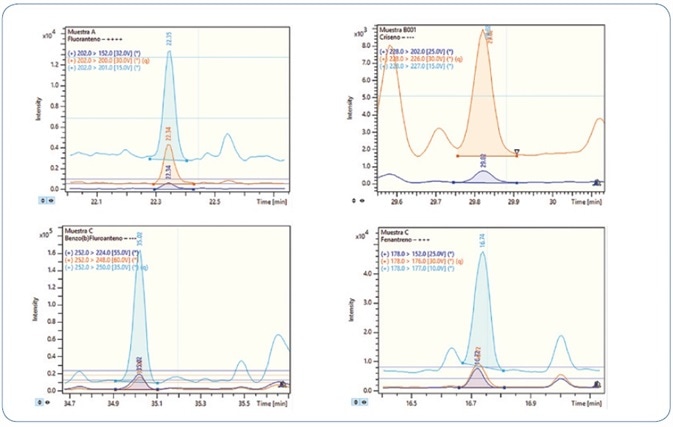
Figure 10. Analysis of different wedge clam extracts spiked at 0.8 µg/kg PAHs. Each time window shows the MRM transitions used for each compound.
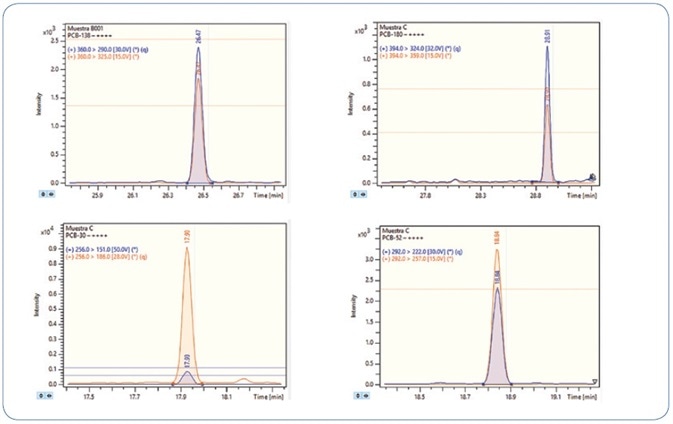
Figure 11. Analysis of different wedge clam extracts spiked at 0.8 µg/kg PCBs. Each time window shows the MRM transitions used for each compound.
To assess the performance of the instrument with a more diluted sample, hard clam extracts spiked at slightly below the requisite limit of quantitation (LOQ) for PAHs/PCBs (0.8 μg/kg) were diluted twice. The required LODs are still surpassed even after diluting the samples twice, as represented in Figure 12. This promotes an increase in robustness of the method as well as the instrument as per the European regulations for routine 24/7 operation.
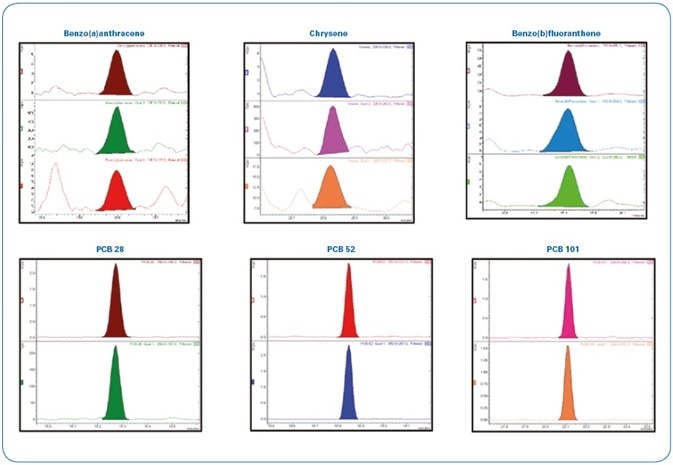
Figure 12. Analysis of a hard clam extract spiked at 0.8 µg/kg with PAHs/PCBs and diluted two-fold (400 femtogram on-column). Each time window shows the MRM transitions used for each compound.
Conclusion
A technique for the analysis of 16 PAHs and 6 markers NDL-PCBs by GC-MS/MS in bivalve mollusks has been devised as per the European Regulations. The outstanding selectivity, sensitivity, and robustness of the Bruker EVOQ GC-TQ Premium MS system allows limits of detection of <0.1 µg/kg while injecting only 1 µL of sample. This sensitivity enables working with diluted samples, which may extend the instrument cleaning and maintenance cycles. The fast 40 m x 0.18 mm GC column exhibits good resolution for compounds that usually co-elute (for example, PCB28/PCB31, B(b)F/B(k)F, B(a)A/Chrysene/Triphenylene).
In addition, the run time is decreased significantly when compared to 60 m columns. A broad linear calibration range (from 0.5 to 100 ppb) with R2 > 0.99 and RSD < 15% was achieved for all the analyzed compounds. The significant reproducibility and performance of the Bruker EVOQ™ GC-TQ MS yielded RSD (%) below 4% at the limit of quantitation for all the compounds analyzed in the seafood samples. This method can be validated for routine 24/7 operation if needed.
References
[1] Commission regulation EU No 252/2012. Laying down methods of sampling and analysis for the official control of levels of dioxins, dioxin like PCBs and non-dioxin-like PCBs in certain foodstuffs and repealing Regulation (EC) No 1883/2006.
[2] Commission regulation EU No 1259/2011 amending regulation (EC) No 1881/2006 as regards maximum levels for dioxins, dioxinlike PCBs and non-dioxin-like PCBs in foodstuffs.
[3] Scientific report of EFSA, Results of monitoring of non-dioxin-like PCBs in food and feed, EFSA Journal OR European Food Safety Authority Journal 2010; 8(7):1071.
[4] Commission regulation (EU) No 835/2011 amending regulation (EC) No 1881/2006 as regards maximum levels for polycyclic aromatic hydrocarbons in foodstuffs.
[5] Commission regulation (EU) No 836/2011 amending regulation (EC) No 333/2007 laying down the methods of sampling and analysis for the official control of the level of lead, cadmium, mercury, inorganic tin, 3-MCPD and benzo(a)pyrene in foodstuffs.
[6] NOAA Technical Memorandum NMFS-NWFSC-59, Extraction, clean-up and Gas Chromatography/Mass Spectrometry analysis of sediments and tissues of organic contaminants, Catherine A. Sloan, Donald W. Brown, Ronald W. Pearce, Richard H. Boyer, Jennie L. Bolton, Douglas G. Burrows, David P. Herman and Margaret M. Krahn, Northwest Fisheries Science Center, Environmental Conservation Division, 2725 Montlake Blvd East, Seattle, Washington 98112, March 2004.
[7] Determination of Polycyclic Aromatic Hydrocarbons (PAHs) in seafood using Gas Chromatography-Mass Spectrometry: A collaborative study, Katerina Mastovski et al. Covance Laboratories Inc. 671 S. Meridian Road, Greenfield, IN 46140.
[8] Evaluation of rapid extraction and analysis techniques for Polycyclic Aromatic Hydrocarbons (PAHs) in seafood by GC/MS/MS, Ed George, Bruker Application Note # GCMS-09 (2015), Bruker Daltonics, Billerica, Massachusetts.
[9] Determination of Polycyclic Aromatic Hydrocarbons in edible seafood by QuEChERS-based extraction and Gas ChromatographyTandem Mass Spectrometry, Yoko S. Johnson, Journal of Food Science 2012; 77(7):131–136.
About Bruker Daltonics
Empowering Science – Improving Life
Bruker Daltonics delivers cutting-edge mass spectrometry solutions and workflows that help scientists and industry leaders tackle real-world challenges and make new discoveries. From life sciences and pharmaceutical research to food and contaminant analysis, environmental monitoring, forensics, and industrial quality control, our technologies and instruments provide the precision and reliability you need to make confident decisions.
Our innovative platforms - such as timsTOF, scimaX, neofleX, and DART-TQ - combined with advanced software like SCiLS™ Lab, MetaboScape®, and Biopharma Compass®, transform complex data into actionable insights. Breakthrough innovations like Trapped Ion Mobility (TIMS), Omnitrap®, and dual ionization GC-HRMS are redefining what’s possible in mass spectrometry.
Trusted by leading research institutes, universities, government agencies, and industrial partners worldwide, Bruker Daltonics is committed to driving scientific progress and delivering solutions that matter.
(For Research Use Only. Not for use in clinical diagnostic procedures).
Sponsored Content Policy: News-Medical.net publishes articles and related content that may be derived from sources where we have existing commercial relationships, provided such content adds value to the core editorial ethos of News-Medical.net, which is to educate and inform site visitors interested in medical research, science, medical devices and treatments.