Formalin-fixation followed by paraffin embedding (FFPE) is the regular step for the preservation of tissue samples. A number of institutions such as universities and hospitals have assembled wide-ranging tissue libraries with corresponding patient information. Thus, FFPE tissue signifies a particularly crucial type of sample to be handled in mass spectrometric imaging (MSI).
Formalin cross-links primary amine groups of protein backbones, while paraffin embedding enables easier sectioning and infinite storage of samples at room temperature. Although the two processes are inherently incompatible with MALDI, further sample processing can be performed to make FFPE samples amenable for MALDI imaging analysis:
- Paraffin has to be removed as it would otherwise obstruct with the following steps in the sample prep workflow as well as the ionization
- Antigen retrieval (AR) must be carried out to disturb a portion of the cross-linked protein network to open cleavage sites for endoproteases such as trypsin
- Lastly, enzymatic digestion is required to free peptides from the remaining cross-linked protein
In this article, a protocol for preparing FFPE tissue sections for MALDI imaging analysis and applying it to different tissues (human thyroid; mouse brain; human breast cancer) using the rapifleX MALDI-TOF/TOF is described. When SciLS Lab was used to analyze the MSI data, it revealed a number of the digested peptides to possess distributions specific to tissue pathology. Also, these peptides can be chosen for fragmentation by TOF/TOF to locate the originating protein behind.
Experiment
Samples
FFPE tissue sections were placed on conductive slides pre-coated with polylysine. Thickness of tissue sections was as follows: human breast cancer 3 µm; human thyroid 6 µm; mouse brain 5 µm. Human thyroid sections were given by Professor Fulvio Magni, University of Milano-Bicocca, Italy. Human breast cancer sections were acquired from Dr Zeljko Debeljak, KBC Osijek, Croatia.
Sample Preparation
Paraffin elimination was done by applying the following protocol: Slides were vertically oriented and heated at 85 °C for 15 minutes; slides were washed in a succession of baths: xylene (5 minutes, 2x; first bath was performed directly after removing the slide from oven); isopropanol (5 minutes, 1x); ethanol gradient (100%, 96%, 70%, 50%, 5 minutes each); water (5 minutes, 1x).
Antigen retrieval was carried out in a NXGEN decloaking chamber (Biocare Medical) at 110 °C for 20 minutes using just deionized water as bath. Processed slides were gradually cooled down by stepwise partial exchange of the hot bath solvent and were dried in a vacuum environment.
Deposition of trypsin (porcine sequencing grade; Promega) was carried out with a HTX TM-sprayer linked to a syringe pump. The deposition technique applied the following parameters: trypsin solution 25 ng/µl in 20 mM ammonium bicarbonate buffer; nitrogen pressure 10 psi; nozzle temperature 30 °C; nozzle height 40 mm; flow rate 0.03 ml/minute; z-arm velocity 750 mm/minute; number of passes 8; moving pattern CC; track spacing 2 mm; drying time 0 second.
Trypsin-coated sections were incubated for 2 hours at 50 °C under humidity-saturated atmosphere. Post incubation, slides were dried in vacuum for 30 minutes.
Deposition of HCCA matrix was done on a HTX TM-sprayer linked to an isocratic LC pump applying the following technique parameters: HCCA solution 10 mg/ml in ACN: H2O 70:30, 1% TFA; nozzle height 40 mm; nitrogen pressure 10 psi; flow rate 0.12 ml/minute; nozzle temperature 75 °C; z-arm velocity 1200 mm/minute; number of passes 4; moving pattern HH; track spacing 3 mm; drying time 0 second.
After MALDI data acquisition, sections were readied for histological staining by eliminating the remaining MALDI matrix by rinsing in 70% ethanol for 2 minutes and then dip-washing in deionized water.
Haematoxylin and Eosin (H&E) staining was carried out in compliance with standard protocols.
Data Acquisition
Before deposition of MALDI matrix, slide-mounted tissue sections were scanned using a Reflecta MF-5000 medium format scanner at a resolution of 3200 dpi.
Extra high-resolution optical images of H&E stained tissue sections were attained on a MIRAX DESK scanner (3DHISTECH) after concluding MALDI data acquisition.
All MALDI-MS imaging data were obtained on a Bruker rapifleX MALDI-TOF/TOF system in positive reflector mode. The following MS image acquisition parameters were enforced:
25 µm pixel size; 400 laser shots per pixel; m/z 700-3200 detection range
20 µm pixel size; 300 laser shots per pixel; m/z 600-2500 detection range
20 µm pixel size; 400 laser shots per pixel; m/z 700-2400 detection range
MALDI-MS/MS spectra of selected peptides were obtained straight from tissue in positive MS/MS mode without needing collision gas. The number of laser shots amassed per spectrum differed based on signal to noise ratio of each peptide. MS/MS imaging of selected precursor peptides was carried out using 40 µm pixel size and 1000 laser shots per pixel.
Data Analysis
Investigation of imaging data, including co-registration of H&E stained optical images, was carried out in SCiLS Lab software. Calculations were carried out on datasets regularized to Total Ion Count (TIC).
Results and Discussion
The FFPE sample processing workflow explained above was applied to various tissue samples and data examined for correlation with tissue architecture, for spatial resolution, and the ability to identify proteins. Figure 1 illustrates results acquired from MALDI-MSI of human thyroid FFPE tissue. The dataset was spatially segmented in SCiLS Lab using an unsupervised multivariate statistical analysis technique. The segmentation map (Figure 1B) features parallel digest spectra to a common color and the color mapping exposes tissue heterogeneity as a function of protein fingerprint, that is, as reflected in the single peptide profiles resulting from on-tissue digestion.
The segmentation tree, illustrated in Figure 1C, offers an overview of the hierarchical structure of pixel cohorts inside the MSI dataset, i.e. describes the level of similarity/dissimilarity between different pixel cohorts. Figure 1D offers in a side-by-side comparison the mean spectra signifying five core branches (i.e. proposed tissue subtypes) from the segmentation result.
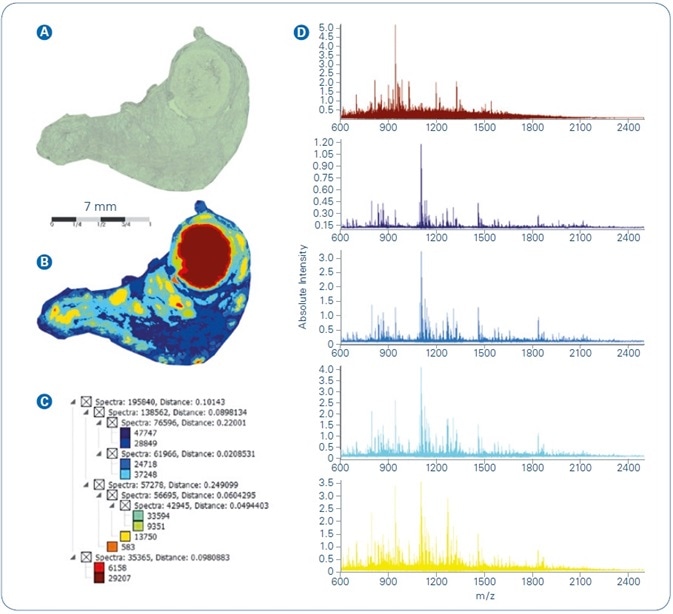
Figure 1. Spatial segmentation analysis of MALDI-MSI dataset from FFPE human thyroid tissue: (A) Optical image; (B) Segmentation map; (C) Segmentation tree; (D) Mean spectra of main regions extracted from segmentation result.
The FFPE sample preparation workflow explained here includes several steps, for example, incubation with the enzyme and matrix deposition, that hold a certain danger of artificial delocalization of peptides. To measure the spatial resolution that can be realized using the workflow, Figure 2 reveals a zoomed view on the human thyroid tissue section together with the matching ion image of m/z feature 644.4. The architectural features seen in this ion image are very consistent with the structures visible on the matching optical image. Additional examination shows that the minimum dimension of structural feature that can be fixed in the image is 40-50 µm, i.e. 2 pixels wide.
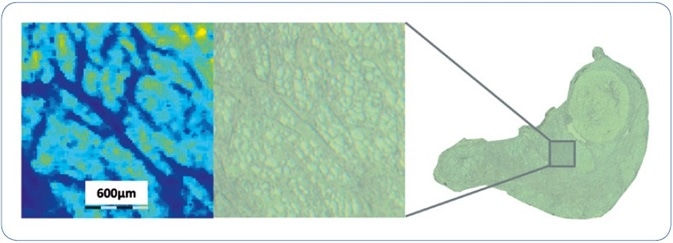
Figure 2. An expanded view of an ion image of m/z 644.4 from a region of human thyroid FFPE tissue to assess the MSI spatial resolution achieved using the sample analysis workflow described. Smallest structural features observed in the MSI dataset are approximately 40-50 µm, i.e. 2 pixels wide.
In a second instance, the workflow was used to image a section of FFPE human breast cancer tissue and outcomes are shown in Figure 3. As before, spatial segmentation examination of the breast cancer tissue generated the map shown in Figure 3B. Along with the parallel hierarchical cluster tree (Figure 3C), and the overlaid H&E image (Figure 3A), the segmentation map specifies a vivid differentiation between section areas that signify low density, that is, fatty and connective tissue (yellow and brown colors) and the higher density tumor tissue (dark and light blue colors), respectively.
To cross-corroborate the segmentation outcomes, the dataset was exposed to Probabilistic Latent Semantic Analysis (PLSA), another technique of unsupervised multivariate data scrutiny that deconvolutes pixel spectra into contributing molecular signatures. On the ensuing PLSA scores plot, displayed in Figure 3D, the image pixels separate into virtually non-overlapping clusters that match to the four core branches of the segmentation tree (i.e. low-density tissue colored yellow/brown versus higher density tumor tissue colored light/dark blue). The outstanding consistency seen when comparing the results achieved from two independent statistical analysis approaches exemplifies the high level of confidence featured by the MALDI-MSI data.
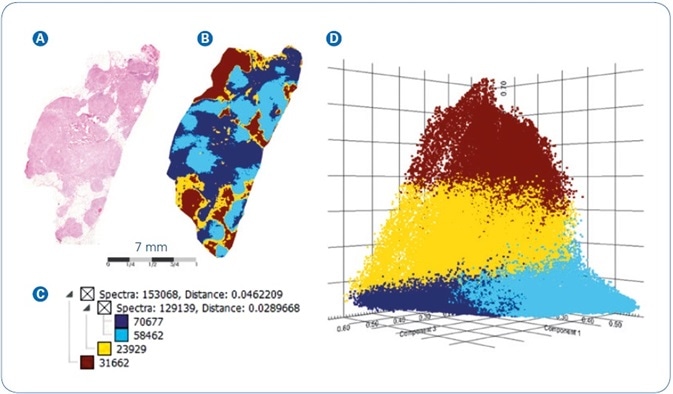
Figure 3. MALDI-MSI analysis of FFPE human breast cancer tissue: (A) Co-registered H&E image of tissue section stained post-MALDI; (B) Spatial segmentation map; (C) Corresponding segmentation tree; (D) PLSA Scores plot from the four main segmentation regions.
Statistical examination of MSI data can produce several putative tissue marker ions. The following step is to recognize the putative peptide and the protein from which it derived. The first choice for such a mission is tandem-mass spectrometry of the peptides straight from tissue. Figure 4 illustrates MALDI-TOF/TOF fragment ion spectra of three peptides that were obtained straight from the tissue regions of maximum local appearance. Precursor m/z 1562.8 (Figure 4A) was chosen for MS/MS analysis as an instance of peptides revealing high relative intensity in the low density tissue regions, while the other two precursors (m/z 1198.7, m/z 944.5, Figure 4B-C) were detected at higher relative peak intensities in the higher density tumor tissue. MASCOT ion searches recognized all three peptides at extremely significant ion score values.
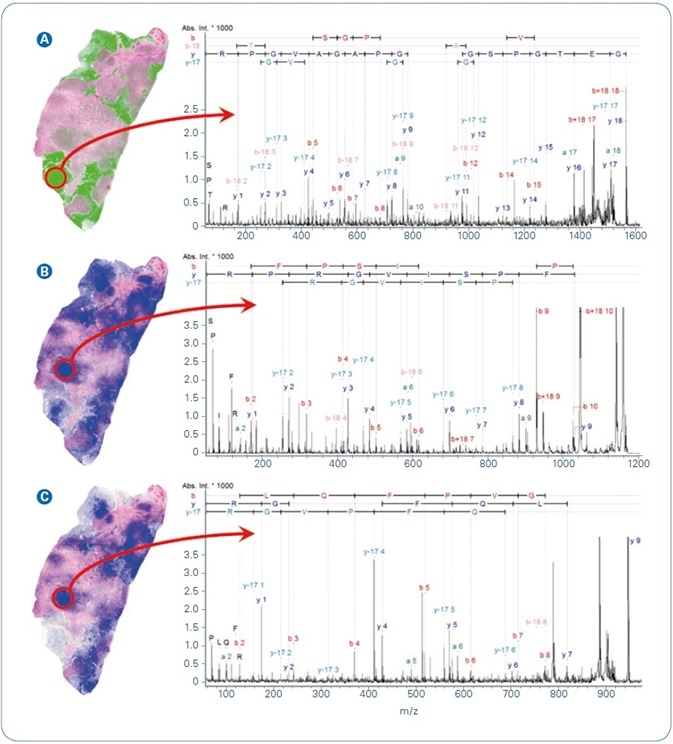
Figure 4. Selected MALDI ion images from FFPE human breast cancer tissue overlayed with co-registered H&E. Peptide identification was achieved by MALDI-MS/MS directly from tissue. (A) m/z 1562.8, GETGPSGPVGPAGAVGPR from Collagen alpha 2; (B) m/z 1198.7, AVFPSIVGRPR from Actin, cytoplasmic 1; (C) m/z 944.5, AGLQFPVGR from Histone H2AV.
With an estimated 10,000 proteins expressed in each cell, on-tissue digestion creates a very complex mixture of analytes. Cases in which numerous nominally-isobaric peptides will cause unwanted interferences in MS ion images can be expected. To remove such interferences, the full imaging experiment can be carried out in MS/MS mode to approve the results acquired from MS imaging. Figure 5 illustrates TOF/TOF imaging results acquired from FFPE mouse brain tissue. Figure 5B illustrates the MS ion image of m/z feature 1198.7, which was recognized using MALDI-MS/MS directly from tissue as peptide AVFPSIVGRPR from Actin, cytoplasmic 1 (Figure 5C).
A following MS/MS imaging experiment was carried out to verify the distribution of this peptide. The peptide´s most plentiful fragment ion [b+18]10 at m/z 1042.4 (Figure 5E) produces an ion image (Figure 5D) that matches with the MS image obtained for m/z 1198.7. The steadiness noticed between MS and MS/MS imaging results specifies the dominance of the identified actin peptide in its contribution to the MS ion image and rejects any major interference from other isobaric peptides.
![MALDI-MSI analysis of FFPE mouse brain tissue: (A) Optical image; (B) MALDI-MS ion image of m/z 1198.7; (C) Annotated MALDI-TOF/TOF spectrum of precursor m/z 1198.7 that was acquired directly from tissue and identified as peptide AVFPSIVGRPR from Actin, cytoplasmic 1; (D) MALDI-MS/MS ion image of m/z 1042.6, the most abundant fragment ion ([b+18]10) from precursor m/z 1198.7; (E) The mean spectrum from dataset D, red arrow indicates the MS/MS transition used to generate the MS/MS ion image.](https://www.news-medical.net/image-handler/picture/2019/3/Job_6041_Art4_Pic5.jpg)
Figure 5. MALDI-MSI analysis of FFPE mouse brain tissue: (A) Optical image; (B) MALDI-MS ion image of m/z 1198.7; (C) Annotated MALDI-TOF/TOF spectrum of precursor m/z 1198.7 that was acquired directly from tissue and identified as peptide AVFPSIVGRPR from Actin, cytoplasmic 1; (D) MALDI-MS/MS ion image of m/z 1042.6, the most abundant fragment ion ([b+18]10) from precursor m/z 1198.7; (E) The mean spectrum from dataset D, red arrow indicates the MS/MS transition used to generate the MS/MS ion image.
Conclusions
- An exclusive workflow has been put forth for preparing samples for MALDI imaging and advanced data examination of FFPE tissue samples, the most typically found type of tissue sample. Applying the protocol for deparaffinization, antigen retrieval and on-tissue digestion, FFPE tissue can be made well-suited for both MALDI MS and MS/MS imaging enabled by the new Bruker rapifleX MALDI-TOF/TOF instrument. Spatial feature resolution of 40-50 µm, restricted by delocalization effects integral in the upfront sample preparation workflow, can be accomplished. RapifleX data acquisition is a lot faster than any formerly available MALDI-MS instrument and incorporation with SCiLS Lab software enables the user to extract extremely confident and comprehensive information from the dataset.
- The exceptional MS/MS capabilities of the rapifleX instrument allow direct identification of peptides from tissue directly. The ability of the instrument to perform rapid MS/MS imaging offers another dimension of specificity and allows you to examine potential interferences that may be prompted by the presence of many isobaric peptides.
About Bruker Daltonics
Empowering Science – Improving Life
Bruker Daltonics delivers cutting-edge mass spectrometry solutions and workflows that help scientists and industry leaders tackle real-world challenges and make new discoveries. From life sciences and pharmaceutical research to food and contaminant analysis, environmental monitoring, forensics, and industrial quality control, our technologies and instruments provide the precision and reliability you need to make confident decisions.
Our innovative platforms - such as timsTOF, scimaX, neofleX, and DART-TQ - combined with advanced software like SCiLS™ Lab, MetaboScape®, and Biopharma Compass®, transform complex data into actionable insights. Breakthrough innovations like Trapped Ion Mobility (TIMS), Omnitrap®, and dual ionization GC-HRMS are redefining what’s possible in mass spectrometry.
Trusted by leading research institutes, universities, government agencies, and industrial partners worldwide, Bruker Daltonics is committed to driving scientific progress and delivering solutions that matter.
(For Research Use Only. Not for use in clinical diagnostic procedures).
Sponsored Content Policy: News-Medical.net publishes articles and related content that may be derived from sources where we have existing commercial relationships, provided such content adds value to the core editorial ethos of News-Medical.net, which is to educate and inform site visitors interested in medical research, science, medical devices and treatments.