The regulatory Maximum Residue Level (MRL) controls the quantification of pesticides in food, feed and environmental samples.
For the study of organic contaminants in water, the use of on-line extraction (OLE) enables the analysis of much larger sample volumes through LC-mass spectrometry, as opposed to direct injection methods. This subsequently allows for the potential to lower limits of quantitation to levels below the regulatory MRL.
The findings outlined in this article have been acquired from an assortment of 128 pesticides in drinking water, with on-line extraction employing an injection volume of 1.6 mL.
The technique has been authenticated in accordance with NF T90-210 norm (assessment protocol for a technique’s performance in a laboratory) with a concentration range between 5 and 200 ng/L and a limit of quantitation (LOQ) of 5 ng/L (MDA of 30%).
This article presents the use of EVOQ Elite™ LC-TQ system with on-line extraction to achieve considerably lower levels of quantitation in comparison with direct injection, whilst supplying precise and reproducible results.
| Keywords |
Instrumentation and Software |
| LCMS |
EVOQ Elite LC-TQ |
| Pesticide Analysis |
MS Workstation 8 |
| Water Analysis |
|
| On-line Extraction |
|
| Triple Quadrupole |
|
| Quantitation |
|
Experimental
| . |
| Instrument |
| Bruker EVOQ Elite™ TQ with OLE |
| Material and reagent: |
Mix of 128 pesticides standards (5 µg/mL)
Ammonium formate (Fluka, 24850743)
Formic acid (ACROS Organics, 10285711) |
| MS parameters |
|
| Ionization mode : |
HESI (+/-), ±4000 V |
| HESI temperature : |
450 °C |
| Source gas : |
40 |
| Nebulization gas : |
45 |
| Cone temperature : |
300 °C |
| Cone gas : |
30 |
| Q1 and Q3 resolution : |
1,0 Da |
| Collision gas : |
Argon, 1,50 mTorr |
| Active Exhaust : |
On |
| Detector : |
Electron Multipler with Extended Dynamic Range (EDR) |
| Extraction conditions |
|
| Column : |
Poroshell 120 EC-C18 (2,1 x 100 mm x 2,7 µm) |
| Extraction cartridge : |
HLB (3,9 x 150 mm x 5 µm) |
| Phase A : |
H2O + 0,01% HCOOH, 5 mM NH4HCO2 |
| Phase B : |
CH3OH |
| Phase C : |
H2O + 0.01% HCOOH |
| Flow : |
300 µL/min |
| Elution Gradient |
|
| Time (min) |
Solvent B (%) |
| 0.00 |
2 |
| 1.00 |
15 |
| 2.50 |
55 |
| 10.00 |
98 |
| 14.00 |
98 |
| 14.10 |
2 |
| 17.00 |
2 |
| Extraction conditions |
|
| Equilibration flow : |
400 µL/min |
| Equilibration time : |
5 min |
| Loading flow : |
400 µL/min |
| Loading time : |
2 min |
| Extraction time : |
11 min |
Preparation
The diverse levels of concentration were prepared through successive dilutions of the main solution (5 mg/L) in mobile phase A (0.01% HCOOH, 5 mM NH4HCO2). The acquisition method, including the compound names, retention times, MRM transitions and their collision energies, was imported from the Bruker Pesticide Library (see Figure 1).
Figure 1. Acquisition parameters automatically calculated by Compound Based Scanning (CBS).
On-Line Extraction (OLE) Workflow
To begin, the extraction cartridge was equilibrated with 400 µL/min of mobile phase C for a period of 5 minutes. 1.6 mL of sample was then loaded onto the trap column with a loading flow of 400 µl/min of mobile phase C for 2 minutes and 10 seconds.
Lastly, the chromatographic gradient back-flushed the trapped compounds from the trap column to the analytical column for a total of 11 minutes to circumvent any possible carryover concerns. The back-flushing led to a reduced peak band broadening and therefore, provided improved efficiency.
Results
The sensitivity and exceptional quantitative performance that can be consistently achieved with the EVOQ Elite can be ascribed to a number of its design features, such as: VIP (Vacuum Insulated Probe) -HESI (Heated Electro Spray Ionization), active exhaust, dual ion funnel and the detector with EDR (Extended Dynamic Range) function.
As such, an LOQ of 5 ng/L has been attained by injecting 1.6 ml of sample volume with on-line extraction (Table 1).
Furthermore, the second switching valve of the Advance OLE-UHPLC module permits a rapid and easy installation of the on-line extraction system, which supports the out-sized injection capacity.
Narrow peak widths resulting from the low dead volumes of the UHPLC Advance and low tailing, in spite of high injection volume, can be seen in the chromatograms in Figure 2.
To showcase the system linearity, a study of the calibration function was also carried out. To determine the reproducibility, five calibration ranges at concentration levels of 5, 10, 50, 100 and 200 ng/L were independently prepared over a number of days.
The calibration model has been authenticated with a statistic approach using a linear regression with 1/x² weighting. The calibration function is suitable for the studied range, so long as the calculated criterion is below the Fisher’s law value.
Different graphical studies have also been carried out with the comparison of absolute, relative residues and recovered quantities with theoretical quantities (Figure 3 and 4). The linearity of the calibration curves (Figure 5) was confirmed and the correlation coefficients R² (Table 1) were each > 0.99.
These findings show that the EDR function of EVOQ Elite™ provides excellent linearity across a broad calibration range. The calculated limit of quantitation for the technique was also analyzed. Five solutions at 5 ng/L were prepared independently and then studied two times under matching conditions.
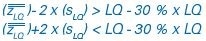
The measured quantities enabled researchers to determine the average quantity calculated  and the standard deviation of intermediate precision calculated (sLQ).
This subsequently enabled the two following inequalities to confirm the accuracy of the calculated quantification limit, according to a MDA (30% of the LQ) (Figure 6).
The excellent reproducibility of the system at low concentrations can be seen in the RSD values of 10 injections at the LOQ (5 ng/L), detailed in Table 1.
Figure 2. Extracted ion chromatograms of quantifiers (red) and qualifiers (green) for 6 pesticides at their limit of quantification (5 ng/L)
Figure 3. Graphical examples of the distribution of relative residues for Chlorpropham
Figure 4. Graphical examples of recovered quantities according to the theoretical quantities for Chlorpropham
Figure 5. Calibration curves of 6 compounds covering 5 ng/L to 200 ng/L
Figure 6. Example of acceptable quantification limits for chlorpropham. All injections are found within a +/-30% deviation tolerance limit of the LOQ
Table 1. Compound list with LOQs obtained for 10 injections at 5 ng/L
| Compound |
Average LQ (ng/L) |
RSD(%) |
R² |
Reported S/N |
| 2,4 D |
5,175 |
8,70 |
0,995989 |
34 |
| 2,4 DB |
5,509 |
6,37 |
0,995866 |
20 |
| Acetochlore |
5,046 |
12,68 |
0,998807 |
40 |
| Acibenzolar-S-methyl |
5,261 |
11,10 |
0,999981 |
27 |
| Aldicarbe sulfone |
4,909 |
11,57 |
0,998586 |
186 |
| Amidosulfuron |
4,831 |
10,76 |
0,998244 |
82 |
| Amitraze |
5,411 |
9,18 |
0,997207 |
13 |
| Azinphos methyl |
5,094 |
7,34 |
0,998031 |
42 |
| Azoxystrobine |
4,956 |
2,82 |
0,998182 |
119 |
| Benoxacor |
4,938 |
4,33 |
0,999548 |
107 |
| Bifenazate |
5,441 |
8,51 |
0,998241 |
300 |
| Boscalid |
4,701 |
12,30 |
0,996636 |
117 |
| Bromuconazole |
4,746 |
11,67 |
0,998110 |
57 |
| Bupirimate |
4,831 |
7,12 |
0,999594 |
67 |
| Chlorbufame |
5,147 |
8,24 |
0,998120 |
11 |
| Chlorfenvinphos |
5,465 |
5,22 |
0,999853 |
96 |
| Chlorprophame |
5,451 |
6,38 |
0,999397 |
14 |
| Chlorpyriphos ethyl |
4,849 |
13,69 |
0,998750 |
96 |
| Chlorpyriphos methyl |
5,302 |
10,66 |
0,997714 |
47 |
| Clethodime |
4,749 |
8,78 |
0,999229 |
18 |
| Clothianidine |
5,184 |
6,71 |
0,997320 |
69 |
| Coumaphos |
5,184 |
8,80 |
0,999882 |
16 |
| Cyazofamide |
5,218 |
12,23 |
0,999554 |
70 |
| Cyclanilide |
4,995 |
2,80 |
0,999025 |
15 |
| Cyproconazole |
4,991 |
9,90 |
0,999721 |
77 |
| Cyprodinil |
5,250 |
7,45 |
0,999833 |
26 |
| Diazinon |
5,215 |
6,21 |
0,999550 |
120 |
| Dicamba |
4,835 |
11,25 |
0,998260 |
107 |
| Dichlormide |
5,158 |
8,43 |
0,998630 |
11 |
| Dichlorprop |
4,966 |
6,46 |
0,999824 |
56 |
| Dichlorvos |
4,815 |
10,30 |
0,999202 |
24 |
| Difenoconazole |
5,498 |
5,62 |
0,997747 |
59 |
| Diflufenican |
4,645 |
10,87 |
0,999953 |
148 |
| Diniconazole |
4,958 |
14,42 |
0,997797 |
24 |
| Disulfoton |
5,163 |
9,84 |
0,998237 |
18 |
| Diuron |
5,022 |
8,10 |
0,999757 |
22 |
| Epoxiconazole |
4,833 |
9,99 |
0,998689 |
60 |
| Ethion |
4,961 |
13,81 |
0,999560 |
140 |
| Ethofumesate |
5,063 |
4,60 |
0,998945 |
20 |
| Fenarimol |
4,986 |
10,59 |
0,999711 |
47 |
| Fenazaquin |
5,073 |
7,59 |
0,999603 |
51 |
| Fenbuconazole |
5,390 |
9,09 |
0,999853 |
28 |
| Fenhexamide |
4,937 |
10,76 |
0,999058 |
31 |
| Fenoxycarbe |
4,885 |
10,52 |
0,999621 |
71 |
| Fenpropidine |
5,047 |
6,16 |
0,997322 |
80 |
| Fenpropimorphe |
4,810 |
8,42 |
0,999419 |
46 |
| Fenthion |
4,773 |
9,99 |
0,993590 |
26 |
| Fenthion sulfone |
5,338 |
10,30 |
0,999825 |
25 |
| Fluazifop |
4,909 |
12,83 |
0,999275 |
23 |
| Fluquinconazole |
4,426 |
9,96 |
0,999668 |
33 |
| Fluroxypyr |
4,907 |
13,63 |
0,998018 |
19 |
| Flurtamone |
4,884 |
7,41 |
0,996359 |
138 |
| Flusilazole |
4,893 |
4,82 |
0,999673 |
345 |
| Fonofos |
4,662 |
10,90 |
0,999696 |
65 |
| Heptenophos |
5,062 |
4,58 |
0,999366 |
225 |
| Hexaconazole |
5,195 |
12,22 |
0,999855 |
66 |
| Hexaflumuron |
4,969 |
7,85 |
0,998889 |
14 |
| Hexythiazox |
5,041 |
8,61 |
0,998435 |
118 |
| Imazalil |
5,091 |
2,42 |
0,999529 |
21 |
| Iodosulfuron methyl |
4,760 |
9,18 |
0,998757 |
35 |
| Ioxynil |
5,189 |
9,75 |
0,998204 |
11 |
| Iprodione |
5,026 |
4,68 |
0,996755 |
16 |
| Iprovalicarbe |
4,950 |
9,56 |
0,999092 |
233 |
| Isophenphos |
5,210 |
11,38 |
0,995352 |
31 |
| Compound |
Average LQ (ng/L) |
RSD(%) |
R² |
Reported S/N |
| Kresoxim methyl |
5,072 |
6,09 |
0,999484 |
47 |
| Linuron |
4,972 |
3,84 |
0,998460 |
42 |
| Lufenuron |
5,144 |
10,30 |
0,999879 |
11 |
| Malathion |
4,609 |
11,95 |
0,999791 |
115 |
| MCPB |
5,086 |
12,72 |
0,999892 |
24 |
| Mepanipyrim |
4,574 |
11,35 |
0,999618 |
45 |
| Mesosulfuron methyl |
4,789 |
10,40 |
0,999479 |
59 |
| Mesotrione |
5,618 |
7,49 |
0,994701 |
130 |
| Metamitron |
4,469 |
9,53 |
0,999140 |
27 |
| Metconazole |
5,310 |
9,85 |
0,999661 |
75 |
| Methiocarbe |
4,880 |
7,87 |
0,999255 |
195 |
| Methomyl |
4,655 |
12,31 |
0,999431 |
30 |
| Metrafenone |
5,668 |
5,80 |
0,999065 |
253 |
| Metribuzine |
5,134 |
11,45 |
0,999102 |
34 |
| Mevinphos |
5,023 |
8,06 |
0,998695 |
109 |
| Molinate |
4,475 |
10,35 |
0,998933 |
133 |
| Myclobutanil |
5,355 |
9,67 |
0,998134 |
32 |
| Napropamide |
4,946 |
8,69 |
0,999952 |
247 |
| Oxadiazon |
4,825 |
13,62 |
0,999100 |
13 |
| Oxadixyl |
4,932 |
9,73 |
0,999147 |
198 |
| Oxyfluorfene |
5,400 |
9,30 |
0,999856 |
11 |
| Paraoxon methyl |
5,539 |
8,54 |
0,999341 |
27 |
| Penconazole |
4,868 |
8,53 |
0,999102 |
62 |
| Pendimethaline |
4,740 |
8,25 |
0,999630 |
61 |
| Penoxsulame |
5,026 |
8,20 |
0,999212 |
26 |
| Phenthoate |
4,745 |
9,59 |
0,999609 |
45 |
| Phosmet |
5,110 |
4,05 |
0,999761 |
187 |
| Picolinafen |
4,823 |
11,69 |
0,998711 |
20 |
| Picoxystrobine |
5,333 |
4,41 |
0,999628 |
258 |
| Piperonyl butoxyde |
4,857 |
8,94 |
0,999925 |
20 |
| Pirimiphos methyl |
5,515 |
6,31 |
0,999290 |
84 |
| Procymidone |
5,261 |
8,10 |
0,998777 |
52 |
| Profenofos |
4,841 |
8,10 |
0,996322 |
223 |
| Propargite |
4,708 |
12,66 |
0,998826 |
163 |
| Propiconazole |
5,184 |
11,38 |
0,998557 |
22 |
| Proquinazid |
4,821 |
13,07 |
0,999294 |
229 |
| Prosulfuron |
5,510 |
9,62 |
0,993397 |
84 |
| Prothioconazole-desthio |
4,922 |
12,64 |
0,994087 |
46 |
| Pyraclostrobine |
4,857 |
9,26 |
0,998278 |
88 |
| Pyrimethanil |
4,522 |
10,04 |
0,994835 |
65 |
| Pyriproxyfene |
4,535 |
4,61 |
0,999835 |
43 |
| Quinoxyfene |
4,610 |
10,76 |
0,998284 |
111 |
| Rotenone |
4,911 |
9,75 |
0,997525 |
27 |
| Simazine |
4,562 |
10,26 |
0,994235 |
50 |
| Spinosad A |
5,644 |
6,59 |
0,994402 |
193 |
| Spiromesifen |
4,885 |
11,05 |
0,997556 |
87 |
| Sulcotrione |
5,058 |
8,17 |
0,999913 |
12 |
| Sulfotep |
4,768 |
10,28 |
0,999945 |
109 |
| Tebuconazole |
5,013 |
10,63 |
0,999899 |
33 |
| Tebufenpyrad |
4,937 |
13,57 |
0,999590 |
46 |
| Terbacile |
4,871 |
10,18 |
0,992290 |
30 |
| Terbufos |
4,730 |
11,25 |
0,998908 |
44 |
| Tetraconazole |
5,233 |
9,99 |
0,996748 |
22 |
| Tetramethrine |
4,570 |
10,79 |
0,998892 |
26 |
| Tolclofos-methyl |
5,525 |
5,01 |
0,993923 |
25 |
| Tolylfluanide |
4,891 |
11,25 |
0,999911 |
25 |
| Triadimefon |
5,433 |
9,37 |
0,998461 |
95 |
| Triadimenol |
4,681 |
9,49 |
0,996542 |
77 |
| Triallate |
4,861 |
10,78 |
0,998324 |
18 |
| Triclopyr |
4,779 |
12,18 |
0,985493 |
39 |
| Trifloxystrobine |
4,807 |
11,05 |
0,998200 |
140 |
| Triforine |
5,086 |
5,84 |
0,999711 |
16 |
| Trinexapac-ethyl |
5,307 |
3,67 |
0,998766 |
37 |
| Zoxamide |
5,095 |
5,57 |
0,999616 |
313 |
Conclusion
It is possible to quantify much lower concentration levels using the Bruker EVOQ Elite™ LC-TQ system coupled with the OLE system, as opposed to using traditional direct injection methods.
Moreover, implementation of on-line extraction significantly lessens the sample preparation costs usually associated with solid phase and liquid-liquid extraction methods. This analysis has successfully shown the quantification of a wide range of pesticides with outstanding linearity, sensitivity, reproducibility, speed and sturdiness.
References
[1] NF T90-210 Mai 2009 - Qualité de l’eau - Protocole d’évaluation initiale des performances d’une méthode dans un laboratoire.
[2] Directive n° 2013/39/UE du 12/08/13 modifiant les directives 2000/60/CE et 2008/105/CE en ce qui concerne les substances prioritaires pour la politique dans le domaine de l’eau
Acknowledgments
Produced from materials originally authored by A. Collgros, A. Hurbain and J. Mohr from Bruker Daltonique, France.
About Bruker Daltonics
Empowering Science – Improving Life
Bruker Daltonics delivers cutting-edge mass spectrometry solutions and workflows that help scientists and industry leaders tackle real-world challenges and make new discoveries. From life sciences and pharmaceutical research to food and contaminant analysis, environmental monitoring, forensics, and industrial quality control, our technologies and instruments provide the precision and reliability you need to make confident decisions.
Our innovative platforms - such as timsTOF, scimaX, neofleX, and DART-TQ - combined with advanced software like SCiLS™ Lab, MetaboScape®, and Biopharma Compass®, transform complex data into actionable insights. Breakthrough innovations like Trapped Ion Mobility (TIMS), Omnitrap®, and dual ionization GC-HRMS are redefining what’s possible in mass spectrometry.
Trusted by leading research institutes, universities, government agencies, and industrial partners worldwide, Bruker Daltonics is committed to driving scientific progress and delivering solutions that matter.
(For Research Use Only. Not for use in clinical diagnostic procedures).
Sponsored Content Policy: News-Medical.net publishes articles and related content that may be derived from sources where we have existing commercial relationships, provided such content adds value to the core editorial ethos of News-Medical.net, which is to educate and inform site visitors interested in medical research, science, medical devices and treatments.