Thanks to its easy and quick use, MALDI-TOF mass spectrometry has a significant analytical edge. The MALDI-TOF spectra of edible oils have multifaceted and delicate features that can be studied with multivariate statistical tools for differentiation and ensuing authentication.
This study combines MALDITOF mass spectrometry with statistical learning tools for the fast organization of olive oils tainted with soybean oils. From a collection of 46 olive oil spectra and 101 spectra of olive oil mixed with 10% soybean oils, the cross validation of the classification model which was built boasted an accuracy level of >99% correct.
Introduction
Corrupting food stuffs to save costs is a deceit which has been undertaken since ancient times. Expensive olive oils have been targeted for this type of fraud for a long time, with lower cost oils, including soy bean oil, frequently employed to adulterate the product.
Mass spectrometry based techniques, principally GC-MS and LC-MS, are commonly employed in creating methods of analysis for detection of adulterated olive oils. There has been a growing use of Matrix-assisted laser desorption ionization time-of-flight mass spectrometry (MALDI-TOF MS) for these analyses [1-4].
In comparison to chromatography based mass spectrometry, MALDI-TOF MS boasts the clear benefits of being easy and quick, without the necessity for laborious chromatographic separation or derivatization.
A process shared by these studies relates to the measurement of the profiles of the triacylglycerols (TAGs), the chief components in all edible oils. Multivariate statistical tools, including principle component analysis (PCA), are frequently employed to visualize the sorting, based on the variations in the TAG profiles in dissimilar oils [1-2].
There are two noteworthy issues with such a methodology: to begin with, the monotonous detection and counting of targeted TAGs, which may not be dependable, on account of their tendency to splinter during sample preparation and within ion sources [5]; secondly, the use of PCA as an unsupervised multivariate statistical visualization tool offers a restricted capacity for prediction and interpretation of findings.
Furthermore, in looking solely at the TAG’s (m/z 850-1000), possible characteristic features in other mass ranges may be overlooked. This study aims to showcase a novel approach, employing a supervised statistical learning model to carry out the non-targeted examination of MALDI-TOF spectra gathered from edible oil samples.
A supervised learning model to predict the classification was built using the sparse least squares analysis discriminant analysis (sPLS-DA), a variation of least squares analysis discriminant analysis (PLS-DA). Cross validation results indicate that predictions on olive oils adulterated with 10% soybean oils boast 99.2% accuracy.
Experimental
Materials and Sample Preparation
A local FDA laboratory offered samples of five olive oil and eight soybean oil brands from local retail stores. The 10% soybean oil adulterated olive oil samples were made by mixing 9:1 (v/v) of the two oils accordingly.
Ahead of the analysis, each oil sample was diluted (200x) using methanol/chloroform (2:1 v/v). The MALDI matrix solution was prepared by dissolving of CHCAE (α-cyano 4-hydroxycinnamic acid methyl ester, Bruker p/n 203071) in methanol/ chloroform (2:1 v/v) for a working solution of 10 mg/ml.
Instrumentation
A benchtop microflex LRF model MALDI-TOF mass spectrometer (Bruker Daltonik GmbH, Bremen) furnished with a nitrogen laser at 337 nm and using a repetition rate of 60 Hz was employed to carry out MALDI-TOF MS analysis. To decrease the risk of detector saturation, the laser power was attuned across a constricted (relative power) range.
The apparatus was activated in reflectron mode with positive ion acquisition, and spectra in the range of m/z 100- 3000 were logged. Between 300 and 500 shots were summed for every spectra. For sample analysis, a pipette was used to drop 1 μL of diluted oil sample onto a stainless steel MALDI plate, before 1 μL matrix solution was placed by pipette onto the oil spot.
Every spot was analyzed three times. For the adulteration classification, 147 spectra were gathered overall: 46 on olive oil (OL) and 101 on 10% soybean oil adulterated olive oil (OS). Under identical conditions, spectra were also gathered for soybean oils alone (SB) and matrix alone.
Statistical Analysis
Each MALDI-TOF MS data file was imported into Bruker’s Profile Analysis software for peak alignment and normalization, before being exported to a .csv file of m/z peaks vs intensities. All in-built CHCAE matrix peaks were removed and omitted from statistical analysis.
The finished .csv file employed for statistical analysis held normalized intensities of 190 m/z peaks within each of the 147 spectra. The statistical computing was carried out with the open source R language (https://www.r-project.org/) with an RStudio code editor (https:// www.rstudio.com/) on a laptop with an i7 processor/12GB RAM running Windows 7.
The mixOmics library (http://mixomics.org/) was set up for PLS-DA and sPLS-DA analysis. The spectral files were distributed at random into a training set which contained around two thirds of the data, and a test set which contained the final third of the data.
The training set aided in creating the statistical learning model, which was subsequently employed to predict the cataloging of the test set for cross-validation. To determine the overall classification accuracy, this computing procedure was carried out 10 times successively, with each occurrence featuring new randomized training and test data sets.
Results
A preliminary study was undertaken to assess a number of MALDI matrices for edible oil analysis, as the profiles of MALDI-TOF spectra depend on the matrix selected.
The results showed that CHCAE allowed for the most abundant features of the MALDI-TOF spectra to be uncovered, especially in the low mass range of m/z 250-600. As such, CHCAE was employed for all ensuing studies.
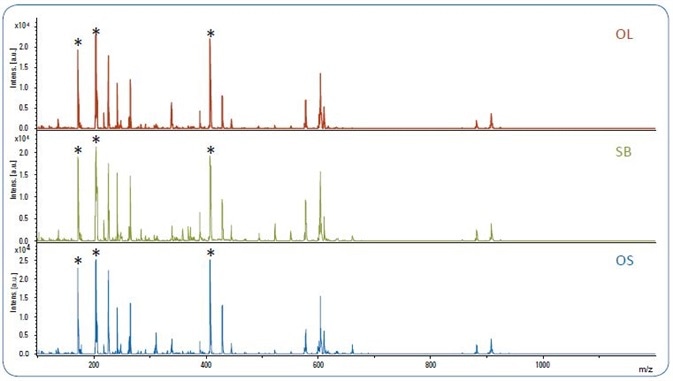
Figure 1. MALDI-TOF spectra of pure olive oil (OL), soybean oil (SB) and olive oil adulterated with 10% soybean oil (OS). The matrix peaks are labeled with*.
It was noted that a low number of peaks (S/N >10) were detected beyond m/z 1200. Figure 1 displays the MALDI-TOF spectra for pure olive oil (OL), pure soybean oil (SB) and 10% adulterated olive oils (OS).
The oil spectra can be separated into four areas, which correspond to four classes of compounds described in the literature [4-7]: ~m/z 900 for TAGs; ~m/z 600 for diacylglycerols (DAGs); ~m/z 400 for monoacylglycerols (MAGs); and m/z < m/z 600~700), as demonstrated by a number of powerful matrix peaks in Figure 1, therefore it is necessary to remove these prior to the application of any statistical analyses.
Statistical learning, also known as machine learning, is fundamentally the processing of “teaching” a computer to track a particular algorithm to acquire the pattern from the known data (training set), before “validating” the learned knowledge by calculating the classification of “unfamiliar” data (test set) [8].
Within this study, two thirds of 146 total data points were employed as the training set, while the other third was used as a test set to corroborate the correctness of the model (cross validation).
To minimize the bias in determining the accuracy of the validation, this “learn-and-predict” cycle was repeated 10 times, with a fresh, randomly chosen set of training and test data sets on each occasion.
Thanks to its adaptability and flexibility as an open source (no cost) platform for statistical data analysis and visualization, R was chosen for statistical learning.
For this classification analysis, two algorithms were selected: the partial least squares discriminant analysis (PLS-DA) and the comparatively recently developed sparse least squares discriminant analysis (sPLS-DA).
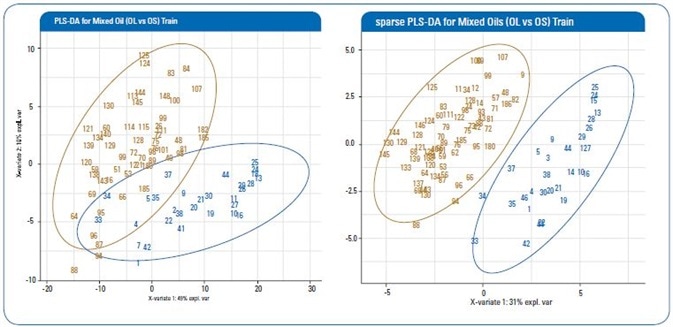
Figure 2. Representative score plot of first vs second components of a training set from the PLS-DA and sparse PLS-DA models (red: OL; blue: OS).
Table 1. Cross Validation of Statistical Learning Models.
| Model |
PLS-DA |
sPLS-DA |
|
Actual
Predict
|
OL |
OS |
OL |
OS |
| OL |
146 |
6 |
159 |
1 |
| OS |
15 |
342 |
3 |
350 |
| % Correct |
95.9% |
99.2% |
Table 1 shows the findings of cross validation from both algorithms, while Figure 2 shows representative score plots of first two components from each algorithm. As can be seen, both PLS-DA and sPLS-DA are capable of classifying OL and OS groups with strong accuracy rates of 95.9% and 99.2%, respectively.
Even so, as can be seen in Figure 2, the sPLS-DA offers a greater quality differentiation and classification of the two oil groups.
A further benefit of the sPLS-DA over PLS-DA is the ease of interpreting findings, as sPLS-DA carries out both the variable selection and classification concurrently.
Within this study, it was found that three components, as a minimum, with each limited to the use of 10 variables (predictors), i.e. a total of 30 m/z peaks (= 3 x 10), were adequate to attain the indicated classification results. The cross validation accuracy was not improved by increasing the components and/or predictors.
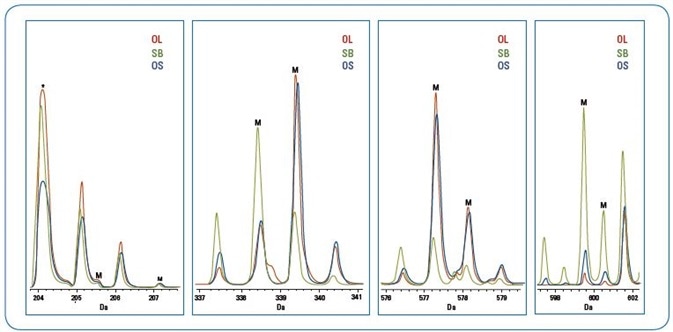
Figure 3. Major biomarker peaks (“M”) identified from sPLS-DA analysis as predicators for differentation of olive oil from soybean oil adulterated olive oil (*indicates a matrix peak) The scales for the spectra within each mass range are arbitrary for illustration of the differences of the three oils.
Table 2. Major Predictors Identified from the sPLS-DA Model.
| |
Component 1 |
Component 2 |
Component 3 |
| Predictors (m/z) |
394.5 |
577.6 |
338.5 |
| 599.5 |
578.6 |
339.4 |
| 600.5 |
205.5 |
|
| |
207.2 |
|
Table 2 details a subcategory of these chief predictor m/z peaks, which can be thought of as possible “biomarkers” for additional study of the subtle spectra variations of the OL and OS groups.
Figure 3 showcases overlaid mass spectra of classification biomarker peaks (likely DAG, MAG, and fatty acid esters fragment ions) for olive oil, soybean oil and 10% adulterated olive oil.
Conclusion
For effective and accurate classification of pure olive and olive oils adulterated with 10% soybean oils, the dual powers of MALDI-TOF mass spectrometry and statistical learning can be employed. The technique offers quick and easy analysis, without requiring the characterization or quantification of any specific chemical component(s) within the oils.
Additionally, supervised statistical learning with sPLS-DA has been demonstrated to be effective in classifying possible biomarkers from complex spectral features, as in non-targeted “omics” studies.
References
- A. Jakab, K. Nagy, K. Heberger, K.Vekey, E. Forgacs. Differentiation of vegetable oils by mass spectrometry with statistical analysis, Rapid Commun. Mass Spectrom. 2002, 15, 2291-2297.
- B. Chapagain, Z. Wiseman, MALDI-TOF/ MS fingerprinting of triacylglycerols (TAGs) in olive oils produced in the Israeli Negev Desert, J. Agric. Food Chem, 2009, 57, 1135-1142.
- G Asbury, K. Al-Saad, W. F. Siems, R. Hannan, H. Hill, Analysis of triacylglycerols and whole oils by matrix-assisted laser desorption/ionization time of flight mass spectrometry, J. Am. Soc. Mass Spectrom. 1999, 10, 983-991.
- J. Lay, R. Liyangage, B. Durham, J. Brooks, Rapid characterization of edible oils by direct matrix assisted laser desorption/ ionization time-of-flight mass spectrometry analysis using triacylglycerols, Rapid Commun. Mass Spectrom. 2006, 20, 952-958.
- J. Gidden, R Liyangage, B. Durham, J. Lay, Reducing fragmentation observed in the matrixassisted laser desorption/ ionization time-of-flight mass spectrometric analysis of triacylglycerols in vegetable oils, Rapid Commun. Mass Spectrom. 2007, 21, 1951-1957.
- C. Calvano, F. Palmisano, C. Zambonin, Laser desorption/ionization time-of-flight mass spectrometry of triacylglycerols in oils, Rapid Commun. Mass Spectrom. 2005, 19, 1315-1320.
- A. Kubo, T. Satoh, Y. Itoh, M. Hashimoto, J. Tamura, R. Cody, Structural analysis of triacylglycerols by using a MALDI-TOF/ TOF system with monoisotopic precursor selection, J. Am. Soc. Mass. Spectrom. 2013, 24, 684-689.
- G. James, D. Witten, T. Hastie, R Tibshirani, An Introduction to Statistical Learning, , Springer Science+Business Media New York, 2013 (6h corrected printing 2015), Chapters 2-6.
About Bruker Daltonics
Empowering Science – Improving Life
Bruker Daltonics delivers cutting-edge mass spectrometry solutions and workflows that help scientists and industry leaders tackle real-world challenges and make new discoveries. From life sciences and pharmaceutical research to food and contaminant analysis, environmental monitoring, forensics, and industrial quality control, our technologies and instruments provide the precision and reliability you need to make confident decisions.
Our innovative platforms - such as timsTOF, scimaX, neofleX, and DART-TQ - combined with advanced software like SCiLS™ Lab, MetaboScape®, and Biopharma Compass®, transform complex data into actionable insights. Breakthrough innovations like Trapped Ion Mobility (TIMS), Omnitrap®, and dual ionization GC-HRMS are redefining what’s possible in mass spectrometry.
Trusted by leading research institutes, universities, government agencies, and industrial partners worldwide, Bruker Daltonics is committed to driving scientific progress and delivering solutions that matter.
(For Research Use Only. Not for use in clinical diagnostic procedures).
Sponsored Content Policy: News-Medical.net publishes articles and related content that may be derived from sources where we have existing commercial relationships, provided such content adds value to the core editorial ethos of News-Medical.net, which is to educate and inform site visitors interested in medical research, science, medical devices and treatments.