Glycosylation - one of the most common forms of posttranslational modification of proteins - is considered to play a role in almost all biological events in eukaryotes, and also in many viruses and prokaryotes.
A tightly regulated enzyme-catalyzed glycosylation machinery determines the addition of so-called glycans, or complex carbohydrates to certain sites of the nascent polypeptide chain, thus directly or indirectly affecting the physicochemical characteristics of proteins or the whole cellular processes. For example, a number of clinical studies could link changes in the glycosylation protein to the manifestation and progression of various diseases, including cancer and autoimmune and infectious diseases.[1, 2]
Moreover, the efficacy, stability, antigenicity, and half-life of proteins have been shown to be affected by their glycosylation status. As a result, the interpretation and exploitation of the cellular glycosylation machinery and its biological implications are very important both for clinical research and quality control in the biopharmaceutical and life sciences industries.[3, 4]
| Keywords |
Instrumentation and Software |
| O-Glycopeptides |
amaZon ETD |
| CID-MS2/MS3 |
ProteinScape |
| ProteinScape |
GlycoQuest |
| GlycoQuest |
|
| Ion Trap |
|
N- and O-glycosylation are the two major forms of protein glycosylation. These are different in terms of the bonded glycan structures and also the glycosylation sites. N-glycosylation refers to the attachment of glycans to the asparagine’s amide group in accordance with the consensus sequence N|X|S/T/C (X ≠ P, C seldom found), whereas the O-glycosylation refers to glycans bond to the hydroxyl group of threonine or serine without following a permanent consensus motif. Most often, O-glycans have been shown to be fixed in regions that have a high content of proline, threonine, and serine.
It is quite difficult to perform the mass spectrometric analysis of glycosylated proteins, and this procedure surpasses the bioinformatic and technical requirements of general proteomic studies. Although the glycol-proteomic analysis of protein N-glycosylation is already relatively developed, this is not the case for O-glycosylation analysis.[5] This is mainly attributed to the lack of a preserved consensus motif for the bonding of O-glycans, and added to this, a universal enzyme, like PNGase F, is also missing, which facilitates the release of all O-glycans from the protein for an independent glycan analysis.
From a biopharmaceutical and clinical standpoint, human blood plasma contains proteins, which offer a significant therapeutic and diagnostic potential. Yet, many human blood plasma proteins are still there that are yet to be fully characterized, especially with regards to their O-glycosylation.
An explorative study on the human blood plasma O-glycoproteome was recently published by Marcus Hoffmann et al.[6] In this regard, an O-glycoproteomic workflow has been created, which effectively integrates the multistage-fragmentation abilities (CID-MS²/MS³) of the Bruker amaZon ETD ion trap mass spectrometer, with the robust glycoproteomic features provided by the Bruker ProteinScape 4.0 software suite.
This article gives a brief overview of the workflow detailed by Marcus Hoffmann for the site-specific O-glycoproteomic analysis of nonspecifically digested human blood plasma (glyco)peptides following the enrichment of HILIC. The article also focuses on the acquisition of CID MS² and MS³ O-glycopeptide spectra, and emphasizes the strengths of ProteinScape 4.0 in relation to the spectra’s automatic classification, annotation, and identification.
Experiment
Sample Preparation and RP-nanoHPLC-ESI-Ion Trap (IT) MSn
Using Proteinase K (Sigma Aldrich), pooled human blood plasma of healthy donors (provided by Affinity Biologicals Inc.) was initially reduced, carbamidomethylated, and proteolytically digested. This Proteinase K cleaves proteins between amino acids X and Y (X-↓-Y), with X = a hydrophobic, aliphatic, or aromatic amino acid; and Y = any type of amino acid.
Post-precipitation with acetonitrile, HILIC-HPLC (ACQUITY UPLC BEH HILIC Column, 130 Å, 1.7 μm, 2.1 x 100 mm; Waters, Manchester, UK; see Table 1 for more details) was used to enrich and fraction the glycopeptides.
Table 1. Glycopeptide enrichment and fractionation via HILIC-HPLC
| LC settings |
|
| System |
UltiMate™ Nano HPLC (Thermo Scientific) |
| Analytical column |
HILIC Column: ACQUITY UPLC BEH HILIC column, 130 Å, 1.7 μm, 2.1 x 100 mm (Waters) |
| Oven temperature |
40 ˚C |
| Eluents |
A: acetonitrile
B: 50 mM ammonium formate in water (pH 4.4) |
| Gradient |
# |
Time [min] |
Flow rate [μl/min] |
B [%] |
| |
1 |
0 |
250 |
20 |
| |
2 |
5 |
250 |
20 |
| |
3 |
30 |
250 |
50 |
| |
4 |
31 |
150 |
90 |
| |
5 |
40 |
150 |
90 |
| |
6 |
40.1 |
150 |
20 |
| |
7 |
50 |
150 |
20 |
| |
8 |
50.1 |
250 |
20 |
| |
9 |
60 |
250 |
20 |
| Fractions |
Collection every 2 min (from 0-34 min), in total 17 fractions |
Mass spectrometric analysis using reversed-phase liquid chromatography (see Table 2 for more details) connected to an amaZon ETD ion trap mass spectrometer was performed on the enriched O-glycopeptide fractions.
Table 2. HPLC settings
| LC settings |
|
| System |
UltiMate™ Nano HPLC (Thermo Scientific) |
| Trap column |
Acclaim PepMap100, C18, 5 μm, 100 Å, 300 μm i.d. x 5 mm |
| Analytical column |
Acclaim PepMap RSLC, C18, 2 μm, 100 Å,75 μm i.d. x 15 cm |
| Oven temperature |
40 ˚C |
| Valve Switching |
2 min and 42 min |
| Eluents |
Loading Pump Solvent 1:
98% water, 2% acetonitrile, 0.05% trifluoroacetic acid
Loading Pump Solvent 2:
20% water , 80% acetonitrile, 0.05% trifluoroacetic acid
Nano Pump Eluent A:
98% water, 2% acetonitrile, 0.1% formic acid
Nano Pump Eluent B:
10% water , 10% 2,2,2-trifluoroethanol, 80% acetonitrile, 0.1% formic acid |
| Gradient |
|
|
Loading Pump |
Nano Pump |
| |
# |
Time [min] |
Flow rate [μl/min] |
B [%] |
Flow rate [μl/min] |
B [%] |
| |
1 |
0 |
7 |
0 |
0.3 |
4 |
| |
2 |
4 |
- |
- |
0.3 |
4 |
| |
3 |
5 |
7 |
0 |
- |
- |
| |
4 |
6 |
30 |
0 |
- |
- |
| |
5 |
30 |
30 |
100 |
- |
- |
| |
6 |
33 |
- |
- |
0.3 |
30 |
| |
7 |
34 |
- |
- |
0.3 |
90 |
| |
8 |
38 |
30 |
100 |
0.3 |
90 |
| |
9 |
39 |
- |
- |
0.3 |
4 |
| |
10 |
40 |
7 |
100 |
- |
- |
| |
11 |
45 |
7 |
100 |
- |
- |
| |
12 |
46 |
7 |
0 |
- |
- |
| |
13 |
60 |
7 |
0 |
0.3 |
4 |
Then, using data-dependent CID-MS2 acquisition, improved resolution fragment spectra in positive ion mode were achieved (see Table 3 for more details). Based on this data, the user determines the precursor ions for MS3 experiments, and these are subsequently examined in a separate run.
Table 3. MS and CID-MS2 parameters
| Acquisition parameters |
|
| Source, Polarity |
nanoFlow ESI Sprayer, positive ion mode |
| MS settings: |
|
| Scan mode |
Enhanced Resolution |
| Scan range |
100–2,500 m/z |
| ICC target, Max. Accu. Time |
300,000, 200 ms |
| Spectra averages |
5 (Rolling averaging: off) |
| SPS tuning mass |
850 m/z |
| MS2 settings: |
|
| Scan mode |
Enhanced Resolution mode |
| Scan range |
100-2500 m/z |
| ICC target, Max. Accu. Time |
300,000, 200 ms |
| No. of precursor ions |
4 (active exclusion after 2 spectra, release after 0.15 min; reconsider precursor, if current intensity/previous intensity > 5) |
| Isolation width |
4 |
| Spectra averages |
3 |
| Fragmentation amplitude (CID) |
1.2 V (SmartFrag 30-200%) |
| Fragmentation time |
40 ms |
| Cut-Off |
27% |
Data Processing and O-Glycopeptide Identification
In the DataAnalysis 4.4, raw data were processed and exported to Protein-Scape 4.0 for semi-automated glycoproteomic analysis. For the identification of proteins, MASCOT was used to search the CID-MS² spectra against the human subset of the UniProtKB/SwissProt database, the results of which are not depicted here.
Corresponding CID-MS² and MS³ spectra of O-glycopeptides were combined for the identification of the glycan and the glycopeptide amino acid sequence. The combined spectra contain peptide fragments (from MS3 fragmentation) and glycan (from MS2 fragmentation). Based on the glycan fragments, ProteinScape measures glycan and peptide mass of each glycopeptide during the classification step. For the identification of glycan, the GlycoQuest search engine, embedded in ProteinScape 4.0 (see Table 4) was used to search the classified O-glycopeptide spectra against the CarbBank database.
Table 4. ProteinScape 4.0 GlycoQuest search parameters
| Parameter |
Value |
| Submitted to search |
Classified glycopeptide CID spectra |
| Glycan type |
- |
| axonomy |
No restriction |
| Database |
CarbBank |
| Composition restriction |
Hex 0-10; HexNAc 0-7; Neu5Ac 0-5; Fuc 0-3 |
| Derivatization |
Underivatized |
| Ionization |
H+ up to 4 |
| MS tolerance |
± 0.3 Da |
| MS/MS tolerance |
± 0.3 Da |
| #13C |
1 |
| Fragmentation |
B-ions, Y-ions; max. 2 cleavages |
Using the peptide mass achieved from the classification step, the combined MS2/MS3 spectra can also be searched through the MASCOT. The spectrum can be correlated with the sequence (no protein search performed) to proof the annotation, provided the peptide sequence is already known. Next, the annotation of glycan and peptide can be combined within a single spectrum.
Results
Here, the results represent a brief extract of the analysis published by Hoffmann and team.[6] The study’s objective was to examine the human blood plasma O-glycoproteome in a site-specific fashion. In this context, an analytical workflow has been improved for the glycoproteomic analysis of nonspecifically digested O-glycopeptides following the enrichment of HILIC. Fundamental to this workflow is the advantageous combination of the multistage fragmentation abilities (CID-MS²/-MS³) of the amaZon ETD ion trap mass spectrometer.
Fragment ions are mainly produced by low-energy CID-MS² fragmentation of O-glycopeptides, and these ions make it possible to identify the composition of glycan. However, this kind of information has to be complemented by identifying the matching peptide moiety. As a result, CID-MS³ experiments were carried out on putative peptide masses that have been chosen manually from CID-MS² spectra. The obtained data were processed in a semi-automated way in order to lower the time-intensive de novo annotation, and this was done by applying the glycoproteomic data analysis features of ProteinScape 4.0. An overview of the workflow is shown in Figure 1, while Figure 2 shows the ProteinScape user interface with some of the key features.
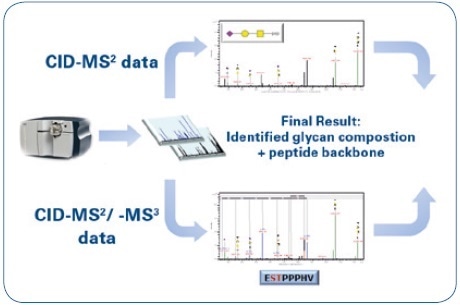
Figure 1. Mass spectrometric workflow for the identification and characterization of O-glycopeptides: Identification of the glycan moiety (CID-MS²) and sequencing of the peptide backbone (CID-MS²/-MS³).
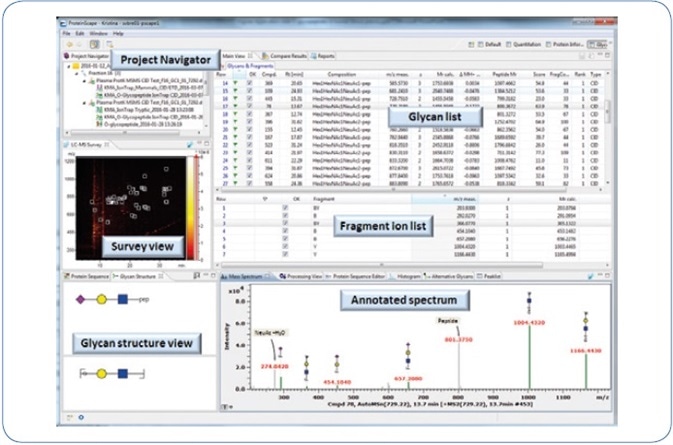
Figure 2. ProteinScape 4.0: GlycoQuest search results of human blood plasma O-glycopeptides.
As detailed in the experimental section, the fragments produced at the time of MS2 fragmentation decide the identification of the glycan moiety. Figure 3 shows an example of an identified glycan moiety.
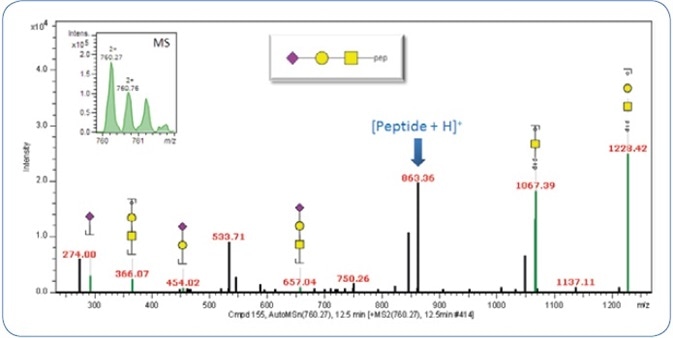
Figure 3. MS2 CID spectrum of the precursor m/z 760.25 (2+). The precursor signal is shown in the upper left.
Only the MS2 spectrum is illustrated in order to decrease the complication, albeit classification and identification can also be carried out on the combined CID-MS2/-MS3 spectra. The ProteinScape software automatically annotates the glycan fragments (Y and also the oxonium ions).
Targeted MS3 experiments on the putative peptide masses were carried out to sequence the peptide backbone. The combined CID-MS2/-MS3 spectra, thus obtained, can be submitted to a MASCOT database search with the help of the peptide mass achieved from the classification, or alternately, they can be directly matched against the hypothetical sequence if already known. As shown in Figure 3, the combined CID-MS2/-MS3 spectrum of the same O-glycopeptide is matched with the peptide sequence 689ESTPPPHV696 obtained from inter-alpha-trypsin inhibitor heavy chain H2 precursor. Figure 4 shows the annotated CID-MSn spectrum, indicating the potential of ProteinScape for combined and automatic annotation of peptide and glycan sequence in a single spectrum.
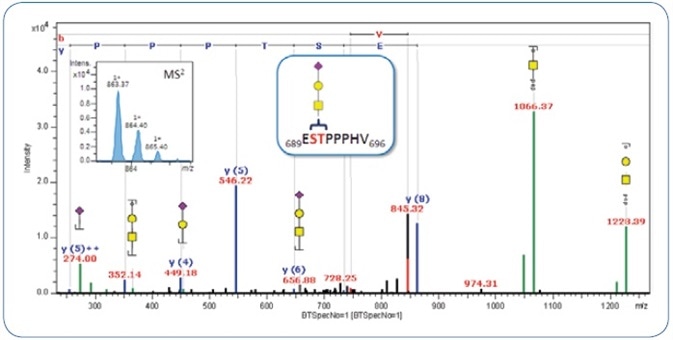
Figure 4. Merged MS2/MS3 CID spectrum of MS2 precursor m/z 760.25 (2+) and MS3 precursor m/z 863.37 (1+). The latter is shown in the upper left.
Hoffmann et al. reported the entire results of the identification and characterization of O-glycopeptides.[6] The researchers have described the meticulous analysis of the data and de novo annotation in their publication.
Conclusion
The non-targeted site-specific analysis of O-glycoproteome - the human blood plasma - was demonstrated by Hoffmann et al.[6] Since the O-glycoproteomic analysis of such a complex sample is very difficult, a dedicated workflow, involving improved sample preparation, fast and sensitive LC-MSn measurements, and advanced bioinformatics tools, is required
This article underscores the robust combination of the ProteinScape 4.0 and the amaZon ETD ion trap mass spectrometer for the O-glycoproteomic analysis of human blood plasma. The amaZon ETD system’s multistage-fragmentation capabilities make it possible to conduct CID-MS² and -MS³ experiments on O-glycopeptides, allowing the identification of the glycan composition as well as sequencing of the peptide backbone. Processing of the acquired spectra was done in ProteinScape 4.0. Using the merged MS2/MS3 CID spectra, classification of glycopeptide spectra and also identification and annotation of glycan and peptide moiety can be simultaneously carried out.
The time needed for interpreting the glycopeptide spectra can be considerably reduced by integrating the ProteinScape bioinformatics platform in the glycoproteomic workflow.
Acknowledgements
Produced from materials originally authored by Marcus Hoffmann1 , Kristina Marx2 , Udo Reichl1,3, Erdmann Rapp1,4. 1) Max Planck Institute for Dynamics of Complex Technical Systems, Bioprocess Engineering, 39106 Magdeburg, Germany 2) Bruker Daltonics, 28359 Bremen, Germany 3) Otto von Guericke University Magdeburg, Chair of Bioprocess Engineering, 39106 Magdeburg, Germany 4) glyXera GmbH, Leipziger Strasse 44 (Zenit), 39120 Magdeburg, Germany.
References
[1] Ceciliani, F., and Pocacqua, V. (2007) The acute phase protein alpha1-acid glycoprotein: a model for altered glycosylation during diseases. Curr. Protein Pept. Sci. 8, 91–108.
[2] Cazet, A., Julien, S., Bobowski, M., Burchell, J., and Delannoy, P. (2010) Tumour-associated carbohydrate antigens in breast cancer. Breast Cancer Res. 12, 204.
[3] Berger, M., Kaup, M., and Blanchard, V. (2012) Protein glycosylation and its impact on biotechnology. Adv. Biochem. Eng. Biotechnol. 127, 165-185 Eng. Biotechnol. 127, 165–185.
[4] Rhodes, J., Campbell, B. J., and Yu, L.-G. (2010) Glycosylation and Disease.
[5] Jensen, P. H., Kolarich, D., and Packer, N. H. (2010) Mucin-type O-glycosylation - putting the pieces together. FEBS J. 277, 81–94.
[6] Hoffmann, M., Marx, K., Reichl, U., Wuhrer, M., and Rapp, E. (2016) Site-specific O-Glycosylation Analysis of Human Blood Plasma Proteins. Mol. Cell. Proteomics 15, 624–641.
About Bruker Daltonics
Empowering Science – Improving Life
Bruker Daltonics delivers cutting-edge mass spectrometry solutions and workflows that help scientists and industry leaders tackle real-world challenges and make new discoveries. From life sciences and pharmaceutical research to food and contaminant analysis, environmental monitoring, forensics, and industrial quality control, our technologies and instruments provide the precision and reliability you need to make confident decisions.
Our innovative platforms - such as timsTOF, scimaX, neofleX, and DART-TQ - combined with advanced software like SCiLS™ Lab, MetaboScape®, and Biopharma Compass®, transform complex data into actionable insights. Breakthrough innovations like Trapped Ion Mobility (TIMS), Omnitrap®, and dual ionization GC-HRMS are redefining what’s possible in mass spectrometry.
Trusted by leading research institutes, universities, government agencies, and industrial partners worldwide, Bruker Daltonics is committed to driving scientific progress and delivering solutions that matter.
(For Research Use Only. Not for use in clinical diagnostic procedures).
Sponsored Content Policy: News-Medical.net publishes articles and related content that may be derived from sources where we have existing commercial relationships, provided such content adds value to the core editorial ethos of News-Medical.net, which is to educate and inform site visitors interested in medical research, science, medical devices and treatments.