Vitamin D is a vital liposoluble vitamin that can be found in many different forms, of which vitamin D3 (cholecalciferol) and D2 (ergocalciferol) (Figure 1) have the most physiological significance. Vitamin D2 is found in fungi and plants, while vitamin D3 is naturally created in animals, including humans. The majority of vitamin D (as vitamin D3) is created in the skin from exposure to sunlight. Only a few foods naturally contain vitamin D (particularly eggs, liver, salmon, herring, and dairy products), though at low levels.
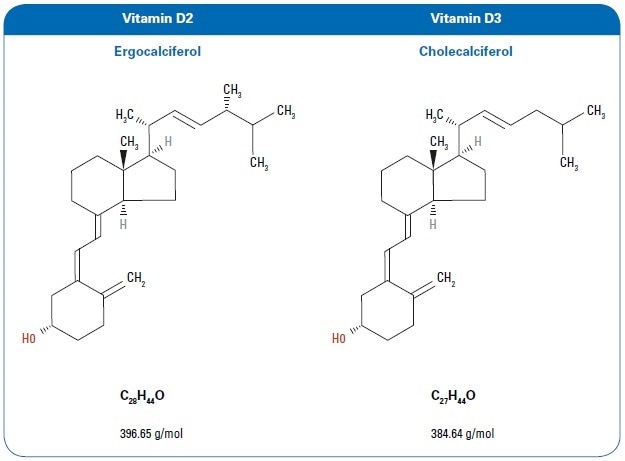
Figure 1. Chemical structure for vitamins D2 and D3.
Therefore, health authorities worldwide [1], mainly in regions with drawn-out winters and limited sunlight, propose dietary vitamin D supplements, especially for more susceptible population groups such as pregnant women, young children, and the elderly. The food sector is thus allowed to produce a few vitamin D-enriched foods, with vitamin D3 being the most extensively used as it binds more firmly to its receptors in the body and is thus more effective at raising and preserving levels of vitamin D.
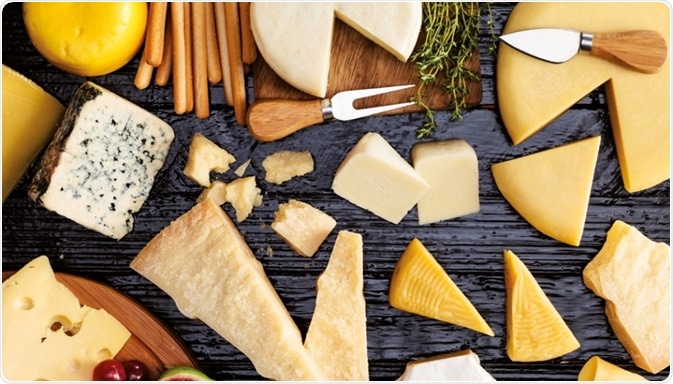
One food that is commonly vitamin D-enriched is cheese. Besides its naturally occurring vitamin D content, cheese provides the benefit that it is a universally accepted foodstuff and that, from an industrial standpoint, the process of enriching it with liposoluble vitamins (namely, A, D, E, and K) is not a complicated one.
Vitamin D has a central role to play in regulating calcium homeostasis and in bone mineralization, as well as in boosting intestinal absorption of calcium. Vitamin D deficiencies can bring about a higher risk of diseases as varied as insulin resistance and diabetes, autoimmune diseases, cancer, cardiovascular disease, and mortality because of various causes. [2]
However, disproportionate vitamin D intake can have an adverse impact on health, resulting in hypercalciuria, hypercalcemia, or kidney complications. Accurately defining vitamin D levels in enriched foods is thus very critical.[3] For adults, the European Food Safety Authority (EFSA) has defined that sufficient intake (AI) should be 15 µg per day and for babies between 7 and 11 months of age 10 µg per day.[4]
The EFSA has defined upper intake levels (ULs) for vitamin D for various population groups, [6] as presented in Table 1.
Table 1. Tolerable upper intake levels for vitamin D. Source: EFSA
| Summary of Tolerable Upper Intake Levels (UL) for Vitamin D |
| Age (years) |
UL for vitamin D (μg/day) |
| 0–1 |
25 |
| 1–10 |
50 |
| 11–17 |
100 |
| Adults (>18) |
100 |
For these reasons, interest in the study of this nutrient has grown intensely in recent years, and relevant analysis criteria have tightened to avoid surpassing permitted enrichment levels. A methodology for examining vitamin D 25-OH, a metabolite usually used for tracking vitamin D concentration in human serum and plasma, has earlier been produced by Bruker. [5]
In this article, a powerful and simple method has been formulated to establish vitamin D3 and D2 levels in enriched cheese samples using the Bruker EVOQ™ LC-TQ Elite MS/MS system.
Experiment
Sample Preparation
A 10 g sample of cheese from the market is homogenized and weighed in an Erlenmeyer flask. A 2% pyrogallol solution is incorporated (40 mL), together with 20 mL of a 50% KOH solution, and a vitamin D2 solution (IS, at a final concentration of 10 ppb). An N2 stream is added and the sample is agitated overnight for saponification. The resulting solution is extracted with 30 mL of hexane to which 12.5 mg/L of butylhydroxytoluene [BHT] has earlier been incorporated. A 10 mL portion of the extract is evaporated and reconstituted with 1 mL of an acetonitrile/water mixture (70/30). The final extract is filtered using a 0.45 µm PTFE filter. Vitamin D3 and D2 standards were supplied by Sigma-Aldrich (Merck, Darmstad, Germany).
Methodology
MS conditions are briefed in Table 2. The measured MRM transitions for vitamins D3 and D2 are illustrated in Table 3, and an example MRM chromatogram can be seen in Figure 2.
Table 2. Mass Spectrometry Method Conditions
| Instrument Conditions |
Bruker EVOQ™ LC-TQ Elite MS/MS system |
| APCI |
Spray current: (+/-) 100 μA |
| Cone Temperature |
250 °C |
| Cone Gas Flow |
15 psi |
| Nebulizer Gas Flow |
30 psi |
| Heated Probe Temperature |
250 °C |
| Probe Gas Flow |
25 psi |
| CID Gas |
Ar, 2.0 mtorr |
| Detector Mode |
EDR |
| Liquid Chromatography |
Bruker Elute™ UHPLC system |
| LC Column |
Bruker Intensity Solo C18 100 x 2.1 mm (P/N:BRKHSC18022100) |
| Mobile Phase A |
Water + 0.1% formic acid |
| Mobile Phase B |
Methanol + 0.1% formic acid |
| Flow Rate |
400 μL/min |
| Injection Volume |
10 μL |
| Column Oven Temperature |
35 °C |
| Gradient |
Time (min) |
Mobile phase A (%) |
| |
0.0
0.5
1.0
5.2
5.3
8.5 |
90
90
0
0
90
90 |
| Total Run Time |
9 min |
| Software |
Hystar 4.1/Bruker MSWS 8.2.1/TASQ 1.4 processing software |
Table 3. MRM transitions for vitamins D2 and D3
| Compound Name |
RT (min.) |
Precursor Ion |
Quan Ion |
CE (V) |
Confirm Ion 1 |
CE (V) |
Confirm Ion 2 |
CE (V) |
| Vitamin D2 (IS) |
5.02 |
397.60 |
69.10 |
-15 |
107.00 |
-15 |
271.30 |
-10 |
| Vitamin D3 |
5.17 |
385.50 |
259.10 |
-10 |
159.10 |
-20 |
- |
- |
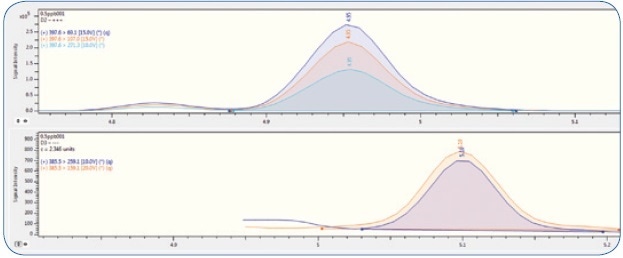
Figure 2. MRM chromatogram of vitamin D2 (top) and D3 (bottom) at 50 ppb level.
Results and Discussion
Linearity
The linearity of the technique was shown with an extracted matrix-matched (quark cheese) calibration curve, meaning the standards had experienced the extraction process explained above. Seven solutions were prepared with the following concentrations: 0.5 ppb, 1 ppb, 5 ppb, 10 ppb, 50 ppb, 100 ppb, and 1000 ppb. Different blank matrices had been injected at a prior stage to confirm the absence of vitamin D.
Figure 3 illustrates the outstanding linearity provided by this technique. The signal for vitamin D3 was linear across the range under examination, with a coefficient of determination of R2 > 0.999 and RSD< 25%. Taking into consideration that the difference between higher and lower calibration levels goes beyond three orders of magnitude, the linearity criteria that are usually required are positively exceeded.
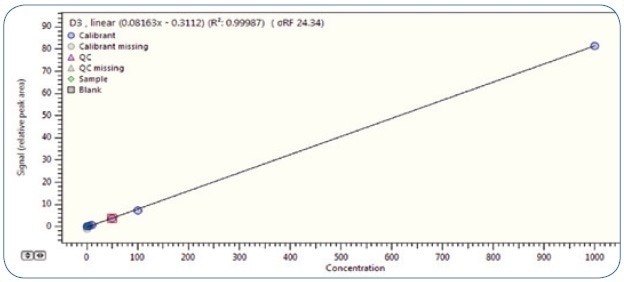
Figure. 3. Calibration curve for vitamin D3 in the concentration range of 0.5-1000 µg/kg (ppb).
Sensitivity and Detection Limits
The Limit of Quantification (LOQ) for vitamin D3 was confirmed at 0.5 µg/kg (ppb), the limit of calibration defined the method. In Figure 4, the comparison of the 0.5 ppb peak signal against the blank quark cheese matrix is shown, representing unmistakable signal at the first calibration level.
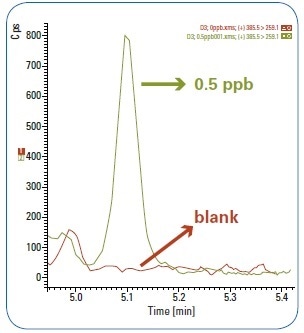
Figure 4. Comparison between LOQ 0.5 ppb peak signal and blank matrix.
To begin the experimental LOD, dwindling concentrations of vitamin D3 were injected into the matrix, down to 0.1 µg/kg (ppb). At this level, three replicates were injected. As illustrated in Figure 5, a S/N ratio of >100 was accomplished for all replicates at 0.1 ppb, offering a precise definition of both the quantification and the confirmation ions. An experimental LOD <0.1 µg/kg (ppb) can thus be proven.
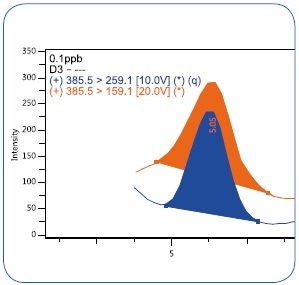
Figure 5. MRM chromatogram of vitamin D3 at 0.1 µg/kg (ppb) level.
Precision and Repeatability
Precision, conveyed as repeatability, was evaluated by examining five replicates (n=5) from each of the five different vitamin D3 concentrations at 0.5 ppb, 1 ppb, 10 ppb, 50 ppb, and 100 ppb.
Figure 6 shows a graph (calculated automatically by the Bruker TASQ software) of vitamin D3 deviation values (RSD) calculated across all replicates (n=5) for all of the above-specified concentrations. As illustrated, the RSDs are below 3.5% across the concentration range under examination, considerably exceeding the commonly accepted quality criteria.
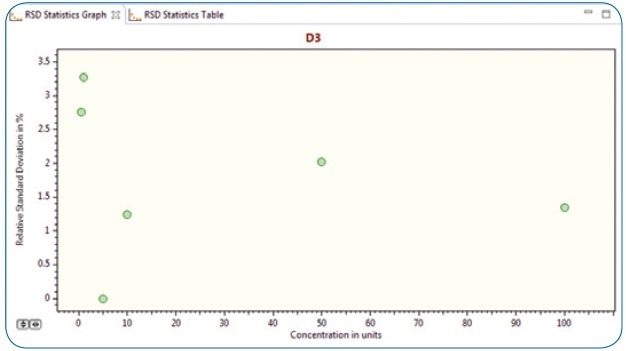
Figure 6. RSD statistics graph (n=5) for vitamin D3 concentrations at 0.5 ppb, 1ppb, 10 ppb, 50 ppb and 100 ppb levels.
Accuracy
With the intention of measuring the accuracy of the technique, five replicates were tested (n=5) from two commercial cheese samples spiked with vitamin D3. Sample 1 contained a fresh cheese (quark) spiked with 250 µg/kg (ppb) of vitamin D3, and Sample 2 contained a semi-soft cheese (cottage cheese) spiked with 100 µg/kg (ppb). None of the cheese samples had detectable levels of natural vitamin D. Table 4 reveals the results for the five replicates of the two examined samples. Recoveries were between 90% and 95%, representing a high level of accuracy.
Table 4. Recovery for cheese samples spiked with vitamin D3
| Vitamin D3 recovery from spiked cheese samples |
| Samples/Replicates |
Replicate 1 |
Replicate 2 |
Replicate 3 |
Replicate 4 |
Replicate 5 |
RSD (%) |
| Quark cheese (spiked with 250 ppb of vitamin D3) |
Vitamin D3 results (ppb) |
236.2 |
236.5 |
232.2 |
233.5 |
223.9 |
2.2 |
| Recovery (%) |
94.5% |
94.6% |
92.9% |
93.4% |
89.6% |
|
| Cottage cheese (spiked with 100 ppb of vitamin D3) |
Vitamin D3 results (ppb) |
92.9 |
91.9 |
94.3 |
96.3 |
95.8 |
2.0 |
| Recovery (%) |
92.9% |
91.9% |
94.3% |
96.3% |
95.8% |
|
Conclusion
A fast and robust technique has been formulated to establish the levels of vitamin D in cheeses using triple quadrupole LC-MS with an APCI interface. The flexibility of the Bruker EVOQ™ LC-TQ Elite MS/MS system, with the option of two ionization modes (APCI and HESI) in a single chamber, offers extra versatility in regularly combining vitamin D analysis with other analyses carried out in quality control labs.
The recommended technique enables fast and selective analyses for vitamin D. The superior sensitivity, with a limit of detection < 0.1 µg/kg (ppb), along with extensive linearity specifies that vitamin D can be reliably proven in enriched foods (including baby foods) without sacrificing the analytical quality of the outcomes, in compliance with present-day regulations.
References
[1] Determination of vitamin D in foods: Current knowledge and data gaps MPI Technical Paper No: 2014/03, New Zealand Government
[2] Vitamin D supplementation reduces insulin resistance in South Asian women living in New Zealand who are insulin resistant and vitamin D deficient - a randomised, placebo-controlled trial. Pamela R von Hurst, Welma Stonehouse, Jane Coad, British Journal of Nutrition 2010; 103(4):549-55.
[3] Vitamin D concentrations in fortified foods and dietary supplements intended for infants: Implications for vitamin D intake. Janneke Verkaik-Kloosterman, S. Marije Seves, Marga C. Ocké, Food Chemistry 2017;221:629-635.
[4] Dietary reference values for vitamin D, EFSA Journal 2016;14(10):4547.
[5]Online Analysis of 25-OH-Vitamin D2/D3 in Plasma and Serum with the EVOQ LC-Triple Quad, Rafaela Martin, Gordon van´t Slot, Bruker Application Note LCMS-103 (2015), Bruker Daltonik GmbH, Bremen, Germany
[6] Tolerable Upper Intake Level of vitamin D, EFSA Journal 2012;10(7):2813.
About Bruker Daltonics
Empowering Science – Improving Life
Bruker Daltonics delivers cutting-edge mass spectrometry solutions and workflows that help scientists and industry leaders tackle real-world challenges and make new discoveries. From life sciences and pharmaceutical research to food and contaminant analysis, environmental monitoring, forensics, and industrial quality control, our technologies and instruments provide the precision and reliability you need to make confident decisions.
Our innovative platforms - such as timsTOF, scimaX, neofleX, and DART-TQ - combined with advanced software like SCiLS™ Lab, MetaboScape®, and Biopharma Compass®, transform complex data into actionable insights. Breakthrough innovations like Trapped Ion Mobility (TIMS), Omnitrap®, and dual ionization GC-HRMS are redefining what’s possible in mass spectrometry.
Trusted by leading research institutes, universities, government agencies, and industrial partners worldwide, Bruker Daltonics is committed to driving scientific progress and delivering solutions that matter.
(For Research Use Only. Not for use in clinical diagnostic procedures).
Sponsored Content Policy: News-Medical.net publishes articles and related content that may be derived from sources where we have existing commercial relationships, provided such content adds value to the core editorial ethos of News-Medical.net, which is to educate and inform site visitors interested in medical research, science, medical devices and treatments.