Therapeutic oligonucleotides conjugated to antibodies represent a rapidly expanding modality in immunotherapy and oncology.1,2 However, similar to their antibody-drug conjugate (ADC) counterparts, antibody-oligonucleotide conjugates (AOCs) exhibit complexity in their payload heterogeneity and linker chemistry.3
Image Credit: Love Employee/Shutterstock.com
Variations in conjugation chemistry conditions can lead to differences in stoichiometries and, ultimately, impact drug safety and efficacy. Therefore, there is an urgent need to measure multiple critical quality attributes (CQAs) for these intricate therapeutic formulations.
There is currently no efficient workflow for the systematic and comprehensive characterization of AOCs. For example, while analytical size-exclusion chromatography (SEC) with UV detection is commonly used to screen for aggregation and fragmentation, it provides limited insight into the composition of peaks and may fail to detect important variations in payload distribution across samples.
Consequently, SEC-UV alone is insufficient for complex samples such as heterogeneous AOC formulations. Similarly, anion exchange chromatography (AEX) is frequently utilized to separate potential oligonucleotide-antibody conjugate (OAR) variations.
However, AEX often fails to resolve aggregates or fragments and may not adequately differentiate between various OAR variants, thereby limiting its utility in purification analysis.
Mass spectrometry (MS) is another widely used technique for quantifying OAR heterogeneity, although its application to AOC samples poses significant challenges. Within the conjugate, the negative charges on the pendant oligonucleotide's phosphate backbone overshadow the antibody's charge contribution, resulting in a significantly negative overall charge profile.
Typical MS methods for protein analysis utilize positive ionization; however, negatively charged oligonucleotides are nearly undetectable except under negative ion mode, complicating the analysis of a hybrid protein-nucleic acid modality such as AOCs.
Furthermore, subjecting such samples to even mild ionization conditions can obscure critical biophysical characteristics such as aggregation and sample polydispersity.
In addition to these challenges, MS requires meticulous sample preparation, which can influence irreversible and reversible aggregation events, potentially leading to precipitation and structural modifications.
To assess the nature of AOC samples under native and high-salt conditions, a gentler, more versatile, and robust analytical technique is necessary.
In the study presented in this article, an easy-to-implement liquid chromatography with multi-angle light scattering (LC-MALS) method for analyzing multiple CQAs of AOCs using standard aqueous mobile phases for SEC and AEX is presented.
The integration of SEC or AEX with MALS and UV detection at two wavelengths enables the quantification of AOC payload heterogeneity, identification of the oligo-antibody ratio, and quantification of payload content.
Materials and methods
AOC samples, oligonucleotide controls, and bare antibodies were generously provided by Takeda Pharmaceutical Company.
Each sample consisted of the same human IgG1 isotype control monoclonal antibody (mAb) conjugated with maleimidomethyl cyclohexane-1-carboxylate (MCC) linker-functionalized luciferase-targeting siRNA (siLuc-MCC, theoretical molar mass = 14.443 kDa, MCC theoretical molar mass = 236.27 g/mol).
Sample 1 primarily included molecules with a single oligonucleotide conjugated to each antibody (OAR1), while Sample 2 primarily contained molecules with two oligonucleotides conjugated to each mAb (OAR2). The molar mass of the human IgG1 isotype control mAb was confirmed by MS at Takeda.
SEC and AEX were conducted using an ACQUITY™ Premier UPLC™ with an eλ PDA detector (Waters Corporation), microDAWN™ MALS detector (Wyatt Technology, LLC), and microOptilab™ dRI detector (Wyatt). UV data was collected at 280 nm and 260 nm with a bandwidth of 1.2 nm.
Data was collected and analyzed using ASTRA™ software (Wyatt). The autosampler was maintained at 6 °C, and the columns were kept at 25 °C throughout the experiments.
For size exclusion chromatography (SEC), separation was conducted using an ACQUITY Premier protein SEC column (1.7 µm, 250 Å, 4.6 mm x 150 mm; Waters). The mobile phase consisted of Dulbecco’s phosphate-buffered saline (PBS) (10 mM Na2HPO4, 1.8 mM KH2PO4, 137 mM NaCl, 2.7 mM KCl, pH 6.7), flowing at a rate of 0.35 mL/minute. To analyze molar mass and oligomeric state (OAR), 3 µL of each AOC sample was injected.
Unconjugated mAb (3 µL), siLuc-MCC (1 µL), and free siLuc (0.15 µL) were utilized to establish the UV extinction coefficients for use in both the SEC-MALS and AEX-MALS analyses.
For AEX, separation was performed using a Gen-Pak™ FAX column (2.5 µm, 4.6 mm x 100 mm; Waters). Mobile phase A consisted of 25 mM Tris at pH 7.5, while mobile phase B comprised 25 mM Tris at pH 7.5 with 1 M NaCl.
A linear gradient was applied for elution, transitioning from 75 % A and 25 % B to 30 % A and 70 % B over 20 minutes, with a flow rate of 0.75 mL/minute. For AEX-MALS analyses, 10 µL of each AOC sample was injected.
Results and discussion
mAb and siLuc-MCC system suitability controls
To ensure accurate conjugate analysis of AOC samples, the molar mass, heterogeneity, and extinction coefficients of the mAb and siRNA were first quantified using SEC-MALS. While UV extinction coefficients for the antibody and siRNA can be estimated through computational predictions, these values can deviate by up to ±10 % from experimental measurements.4
To enhance analytical accuracy, we measured the experimental UV extinction coefficients of the mAb and siRNA directly from chromatography, as outlined in Table 1.
Table 1. Experimental UV Extinction Coefficients determined via online SEC-MALS. Source: Waters | Wyatt Technology
| |
ε280 (mL mg-1 cm-1) |
ε260 (mL mg-1 cm-1) |
| Human IgG1 isotype control mAb |
1.546 ± 0.000 |
0.847 ± 0.000 |
| siLuc-MCC |
10.805 ± 0.015 |
21.795 ± 0.090 |
All values are average and standard deviation of three injections.
The human IgG1 isotype control mAb was primarily composed of protein monomer, with a molar mass of 145.8 ± 0.1 kDa as determined by MALS (Figure 1). This result closely aligns with intact MS measurements, which reported a mass of 145.496 kDa. The mAb predominantly exists as a monomer, with minimal dimer formation.
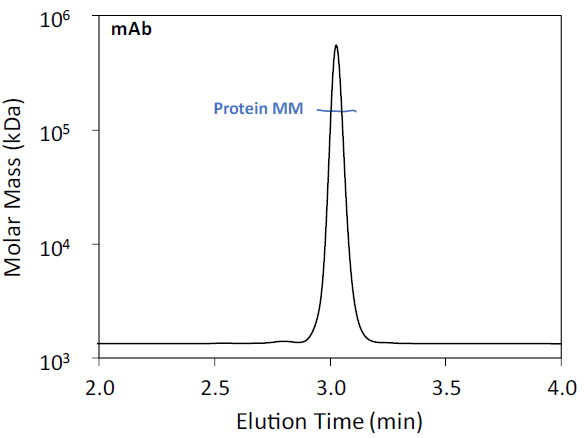
Figure 1. SEC-MALS of human IgG1 isotype control mAb. UV 280 nm chromatogram is shown with the molar mass overlaid. Image Credit: Waters | Wyatt Technology
Interestingly, while the free siLuc RNA exists solely as a monomer, SEC-MALS revealed that the MCC-linker-functionalized siLuc-MCC RNA forms a distinct dimer (Figure 2).
The presence of this siLuc-MCC dimer could be an important quality consideration for siRNA. The measured molar mass for siLuc is 14.0 ± 0.1 kDa, while the siLuc-MCC monomer has a molar mass of 14.2 ± 0.3 kDa, and the dimer measures 28.3 ± 0.4 kDa - closely matching the expected theoretical molar mass of 14.4 kDa for the siLuc-MCC monomer.
The UV extinction coefficients and measured molar masses determined by SEC-MALS were then used to analyze the complete AOC via SEC-MALS and AEX-MALS.
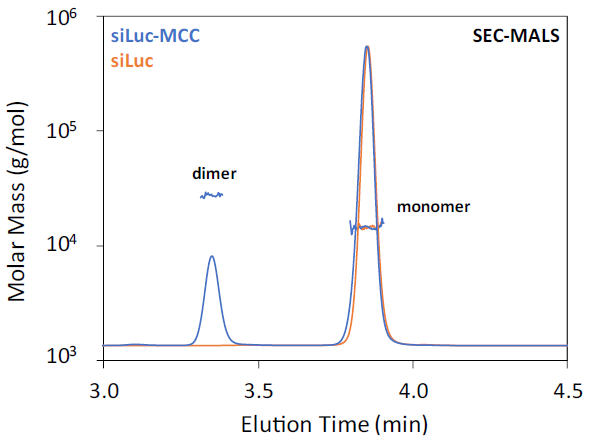
Figure 2. SEC-MALS of siLuc and siLuc-MCC. UV 260 nm chromatogram is shown with the molar mass overlaid. Image Credit: Waters | Wyatt Technology
Sample 1: UV-UV-MALS reveals unexpected species by SEC and AEX
The integration of liquid chromatography separation with MALS detection and UV absorbance measurements at 280 nm and 260 nm facilitated a direct assessment of the composition of the eluting species, thereby providing insights into the oligomeric state and heterogeneity of each peak.
SEC and AEX analyses indicated that Sample 1 comprised over 90 % w/w monomer with OAR1, as anticipated. However, each technique identified slightly different minor species within the sample. SEC-MALS confirmed that the principal drug species is indeed OAR1.
Additionally, SEC-MALS indicated the presence of an OAR1 dimer and low-abundance high molecular weight (HMW) aggregates (<2 % w/w). Despite the heterogeneous nature of the HMW aggregates, the OAR for the HMW is also approximately 1.
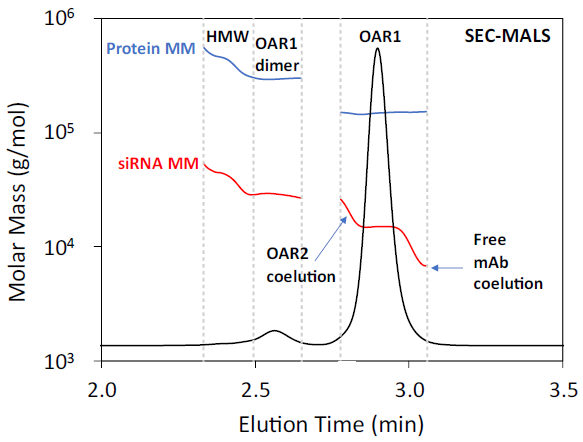
Figure 3. SEC-MALS of AOC Sample 1. The UV 8 nm chromatogram is shown with the molar mass overlaid. Peak boundaries are indicated by the vertical dashed lines. Image Credit: Waters | Wyatt Technology
SEC-MALS data also indicates the presence of a small amount of unconjugated antibody co-eluting with the main monomer. This is reflected in a decrease in the measured siRNA molar mass on the trailing edge of the monomer peak, while the mAb maintains a constant molar mass - suggesting a reduction in siRNA:mAb stoichiometry.
Because free mAb does not appear as a distinct chromatographic feature, its presence would go undetected using SEC-UV alone.
Similarly, SEC-MALS data suggests that a small amount of OAR2 co-elutes with the main monomer. This is evidenced by an increase in siRNA molar mass on the leading edge of the monomer peak, while the mAb molar mass remains unchanged.
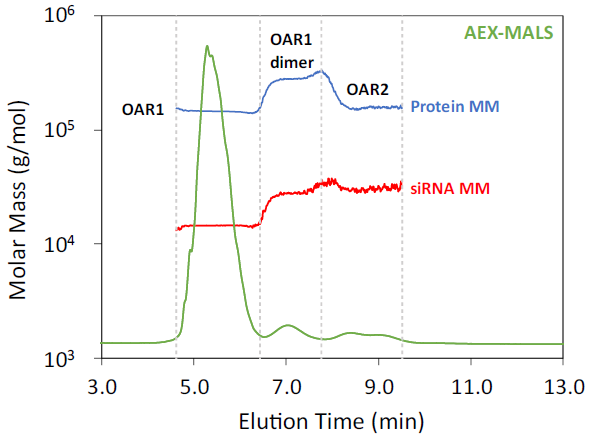
Figure 4. AEX-MALS chromatogram of AOC Sample 1. UV 280 nm chromatogram is shown with the molar mass overlaid. Peak boundaries are indicated by the vertical dashed lines. Image Credit: Waters | Wyatt Technology
Table 2. SEC-MALS and AEX-MALS results of Sample 1. Species are defined as shown in Figure 3 and Figure 4. Source: Waters | Wyatt Technology
| |
SEC-MALS 1 |
AEX-MALS 2 |
Mass
Fraction (%) |
mAb
Mw (kDa) |
siRNA
Mw (kDa) |
OAR |
Mass
Fraction (%) |
mAb
Mw (kDa) |
siRNA
Mw (kDa) |
OAR |
| OAR13 |
93.4 ± 0 |
148.6 ± 0.1 |
14.9 ± 0 |
1.02 ± 0.00 |
90.8 ± 0.1 |
146.4 ± 0.3 |
14.5 ± 0.1 |
1.01 ± 0.00 |
| OAR2 |
ND4 |
-- |
-- |
-- |
3.9 ± 0.1 |
169.8 ± 4.0 |
29.4 ± 1.6 |
1.75 ± 0.06 |
OAR1
dimer |
5.1 ± 0.1 |
296.2 ± 1.2 |
29 ± 0.1 |
0.99 ± 0.00 |
5.4 ± 0.1 |
274.7 ± 0.9 |
26.8 ± 0.6 |
0.99 ± 0.02 |
| HMW |
1.5 ± 0.1 |
384 ± 3.2 |
36.8 ± 0.4 |
0.97 ± 0.00 |
ND4 |
-- |
-- |
-- |
Average
OAR |
|
1.02 ± 0.00 |
|
1.03 ± 0.01 |
1 All values are the average and standard deviation of three injections with a total injected mass of 38.3 μg.
2 All values are the average and standard deviation of three injections with a total injected mass of 127.6 μg.
3 Including coeluting free mAbs.
4 ND: not determined; this species was not resolved under this separation method.
AEX-MALS confirmed the presence of OAR1 monomer and dimer in similar abundances as determined by SEC-MALS. AEX-MALS successfully separated the small amount of OAR2 species, as shown in Figure 4, which co-eluted with the main peak as observed by SEC-MALS.
This OAR2 species constitutes approximately 4 % of the total mass. It is important to note that without the molar mass information provided by MALS, AEX-UV alone could not distinguish between aggregates and OAR variants, particularly given the unpredictable elution order.
Both SEC-MALS and AEX-MALS demonstrated that the conjugation chemistry is specific in producing the correct OAR, although the process may have introduced aggregation.
Whether the OAR1 dimer or the HMW aggregates, these non-covalently bound species are generally challenging to resolve using MS, especially under native conditions. In this context, SEC-MALS and AEX-MALS provided a straightforward and robust method for analyzing their presence and composition.
The key results are summarized in Table 2.
Due to the coelution of certain species, the weight average molar mass (Mw) is slightly different from the theoretical values; however, the OAR number aligns with expectations.
Sample 2: AEX-MALS confirms suspected OAR1 contaminant observed by SEC-MALS
Both SEC and AEX confirm that Sample 2 consists of a product primarily containing OAR2, as designed.
Similar to Sample 1, dimer and high-molecular-weight species were evident in the SEC-MALS analysis, with some detection by AEX-MALS.
Unlike Sample 1, SEC-MALS suggests the presence of monomer species with undesired OAR, which were subsequently confirmed by AEX-MALS.
SEC-MALS revealed the existence of an OAR2 dimer, consisting of two antibodies and four siRNA molecules, along with HMW aggregates with an average OAR close to 2, as shown in Figure 5 (left) and Table 2. Additionally, a small quantity of OAR1 species co-eluted with the main OAR2 species in SEC.
Despite only achieving partial separation with SEC, combined UV-UV-MALS detection effectively identifies the complex nature of the sample by measuring the molar mass of the mAb and siRNA throughout the chromatogram.
As with Sample 1, the conjugation chemistry for Sample 2 is largely specific. AEX analysis fully resolved the OAR1 contaminant from the main OAR2 drug species, as shown in Figure 5 (right), allowing us to quantify it as comprising approximately 7.5% w/w of the sample.
However, compared to Sample 1, this chemistry appears to have generated a higher proportion of dimer and aggregates relative to the total mass. The presence of the OAR1 species may be attributed to unconjugated mAb or may indicate that the conjugation chemistry is reversible.5
Future LC-MALS studies under stress conditions could provide further insights into the reversibility, stability, and degradation of AOC samples.
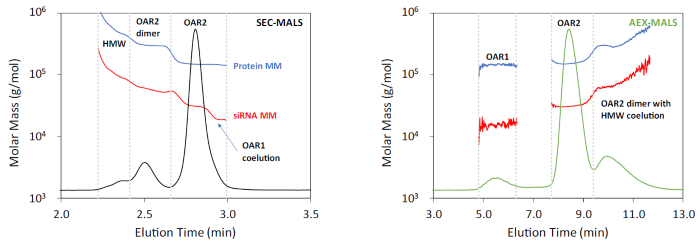
Figure 5. Left: SEC-MALS of AOC Sample 2. The UV 8 nm chromatogram is shown with the molar mass overlaid. Peak boundaries are indicated by the vertical dashed lines. Right: AEX-MALS of AOC Sample 2. The UV 8 nm chromatogram is shown with the molar mass overlaid. Peak boundaries are indicated by the vertical dashed lines. Image Credit: Waters | Wyatt Technology
Table 3. MALS results of Sample 2. Species are defined as in Figure 5. Source: Waters | Wyatt Technology
| |
SEC-MALS 1 |
AEX-MALS 2 |
Mass
Fraction (%) |
mAb
Mw (kDa) |
siRNA
Mw (kDa) |
OAR |
Mass
Fraction (%) |
mAb
Mw (kDa) |
siRNA
Mw (kDa) |
OAR |
| OAR1 |
ND4 |
-- |
-- |
-- |
7.5 ± 0.2 |
147.5 ± 8.6 |
15.6 ± 1.5 |
1.07 ± 0.04 |
| OAR23 |
79.2 ± 0.1 |
150.1 ± 0.3 |
30.0 ± 0.1 |
2.03 ± 0.01 |
67.8 ± 0.4 |
156.9 ± 0.4 |
31.6 ± 0.1 |
2.04 ± 0.00 |
| OAR2 dimer |
15.8 ± 0.0 |
310.0 ± 1.0 |
59.9 ± 0.7 |
1.96 ± 0.02 |
22.1 ± 0.2 |
322.7 ± 3.3 |
73.7 ± 2.1 |
2.31 ± 0.05 |
| HMW |
5.0 ± 0.1 |
529.5 ± 5.2 |
99.0 ± 2.3 |
1.89 ± 0.04 |
ND4 |
-- |
-- |
-- |
Average
OAR |
|
1.99 ± 0.02 |
|
2.07 ± 0.03 |
1 All values are the average and standard deviation of three injections with a total injected mass of 8.01 μg.
2 All values are the average and standard deviation of three injections with a total injected mass of 26.7 μg.
3 Including coeluting OAR1 species.
4 ND: not determined; this species was not resolved under this separation method.
Conclusions
The integration of separation techniques with multiple detection methods, including MALS, UV at various wavelengths, and differential refractive index, significantly enhances the capabilities of traditional liquid chromatography for analyzing AOCs.
SEC provides size-based separation, providing essential insights into AOC aggregates, fragments, and unconjugated nucleic acids. However, relying solely on SEC-UV may overlook critical features and variations in payload distribution.
Similarly, AEX utilizes charged-based separation to achieve improved resolution of payload variants, yet AEX-UV alone may misidentify eluting peaks.
By incorporating UV260, UV280, MALS, and differential refractive index detection into either separation technique, the molar mass and composition of eluting species can be simultaneously measured throughout the entire chromatogram, allowing for precise quantification of payloads in AOCs.
The findings in this study highlight LC-MALS as a versatile platform for measuring multiple critical quality attributes in a single, rapid, and reliable workflow.
This approach is valuable across all stages of AOC product and process development, including research, formulation, and quality assurance. By integrating these analyses into a unified workflow, LC-MALS simplifies system setup, conserves time and resources, and reduces potential errors.
Acknowledgments
Produced from material originally authored by Connor Brandenburg from Takeda Pharmaceutical Company, and Hongjiang (Leo) Liu and Sophia Kenrick from Wyatt Technology.
References and further reading
- Mullard, A. (2021). Antibody–oligonucleotide conjugates enter the clinic. Nature Reviews Drug Discovery, 21(1), pp.6–8. https://doi.org/10.1038/d41573-021-00213-5.
- Dovgan, I., et al. (2019). Antibody–Oligonucleotide Conjugates as Therapeutic, Imaging, and Detection Agents. Bioconjugate Chemistry, 30(10), pp.2483–2501. https://doi.org/10.1021/acs.bioconjchem.9b00306.
- Dugal-Tessier, J., Thirumalairajan, S. and Jain, N. (2021). Antibody-Oligonucleotide Conjugates: A Twist to Antibody-Drug Conjugates. Journal of Clinical Medicine, 10(4), p.838. https://doi.org/10.3390/jcm10040838.
- Batabyal, D., et al. (2021). Determination of the experimental extinction coefficient of therapeutic proteins using the Edelhoch method. Biologicals, [online] 71, pp.42–47. https://doi.org/10.1016/j.biologicals.2021.03.003.
- Szijj, P.A., Bahou, C. and Chudasama, V. (2018). Minireview: Addressing the retro-Michael instability of maleimide bioconjugates. Drug Discovery Today: Technologies, 30, pp.27–34. https://doi.org/10.1016/j.ddtec.2018.07.002.
About Waters | Wyatt Technology
Wyatt Technology Corporation develops instrumentation, software and techniques for the characterization of macromolecules and nanoparticles, in solution, based on light scattering and related technologies. The physical properties determined by Wyatt’s products include absolute molar mass of proteins, polymers and other macromolecules; size and charge (zeta potential); protein-protein and other biomolecular interactions; composition of conjugated proteins and co-polymers; and macromolecular conformation.
Products and services
Wyatt’s product line includes instruments and software for:
- on-line multi-angle light scattering (MALS), used in conjunction with size-exclusion chromatography to quantify absolute molar mass, size, conformation, conjugation and aggregation
- traditional (cuvette-based) and high-throughput (microwell plate-based) dynamic light scattering (DLS) to determine size (radius) and size distributions, protein melting temperature and stability-indicating parameters
- electrophoretic mobility (PALS) to determine molecular charge/zeta potential
- composition-gradient light scattering for label-free analysis of biomolecular interactions
- field-flow fractionation for separation of macromolecules and nanoparticles from 1-1000 nm, used in conjunction with on-line light scattering and other detection technologies to quantify molar mass and size
Wyatt also offers, on a limited basis, sample analysis services utilizing its unique technologies.
Sponsored Content Policy: News-Medical.net publishes articles and related content that may be derived from sources where we have existing commercial relationships, provided such content adds value to the core editorial ethos of News-Medical.Net which is to educate and inform site visitors interested in medical research, science, medical devices and treatments.