DR commonly develops as an asymptomatic complication in adults with diabetes but may lead to preventable blindness over time. The risk of DR progression is variable among individuals and is affected by multiple factors. Therefore, it is challenging to predict the risk and rate of DR progression in patients. As a result, patients are recommended to screen for DR every year. The lack of a personalized risk model and accurate prediction system prevents physicians from recommending an extension of the screening interval despite the approach being very cost-effective.
Artificial intelligence (especially DL) has shown promise in automating DR detection from retinal images. However, current research lacks prospective risk prediction for DR onset and progression beyond a two-year timeframe, and further studies are needed to assess the impact on patient outcomes and integration into clinical workflows.
To address these gaps, researchers in the present study built on their previous work and developed, validated, and tested "DeepDR Plus" as a tool to predict DR progression trajectories up to five years ahead. Further, they demonstrated the outcome of the tool via a real-world study conducted in patients with diabetes.
About the study
DeepDR Plus was pre-trained on 717,308 fundus images from 179,327 diabetic individuals enrolled in the Shanghai Integrated Diabetes Prevention and Care System and the Shanghai Diabetes Prevention Program. Internal development and validation were done using a dataset of 76,400 fundus images from the Diabetic Retinopathy Progression Study (DRPS) cohort, further divided into developmental and internal test sets. Concordance index (C-index) and Integrated Brier Score (IBS) were used to evaluate the performance of the fundus model. The model's generalizability was assessed through external validations using eight independent longitudinal cohorts with comprehensive baseline demographic, anthropometric, and biochemical data. The DR grades were distributed based on the International Clinical Diabetic Retinopathy Disease Severity Scale. Three subgroups of patients were created for further analysis: (1) diabetes with no retinopathy to DR, (2) non-referable DR to referable DR, and (3) non-vision-threatening DR to vision-threatening DR. Statistical analysis involved the use of log-rank test, Cox regression analysis, and the determination of the area under the curve, mean absolute error, and coefficient of determination.
To apply DeepDR Plus in a real-world setting, a community-based prospective cohort study was conducted. It included 2,185 Chinese adults divided into integrated management (IM) and non-IM groups. The fundus and metadata models were used to assess the DR progression risk. Additionally, a real-world study was conducted within an Indian prospective cohort among 992 diabetic patients who underwent four years of follow-up.
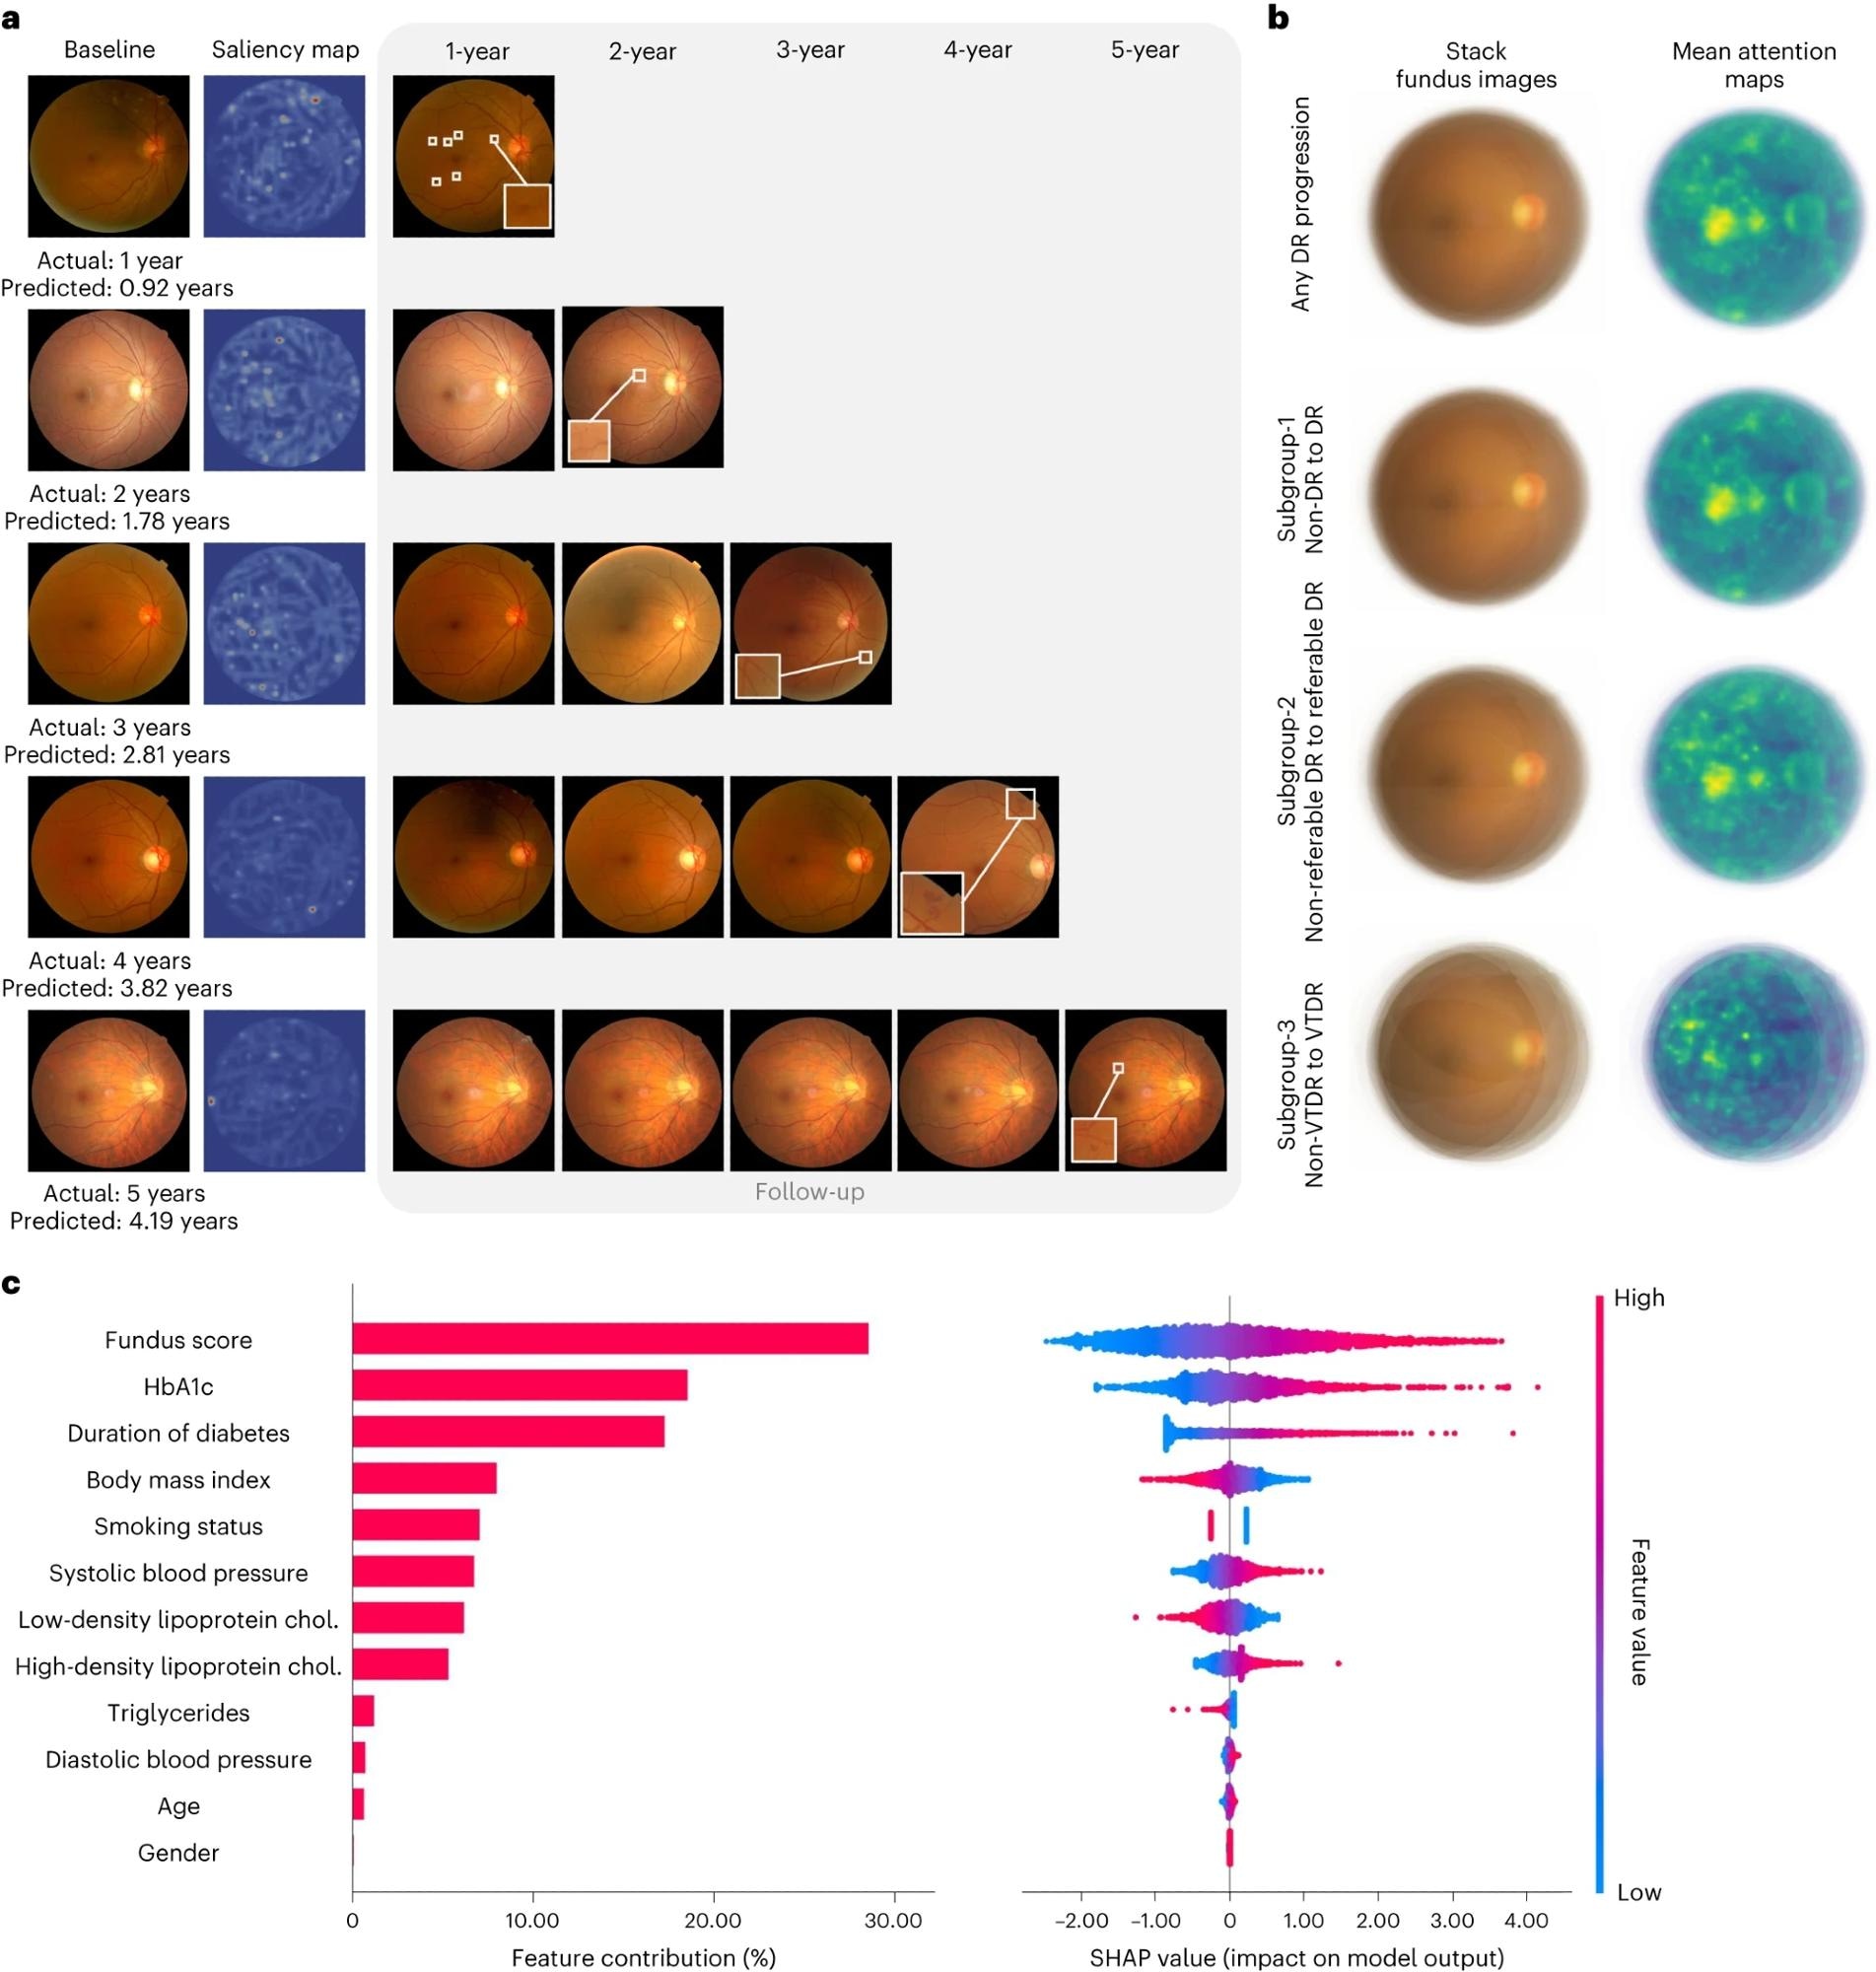 a, Comparisons of color fundus photographs at baseline and follow-up using attention maps. b, Mean attention maps and corresponding stack fundus images for any DR progression and subgroups 1–3. c, Bar plot (left) of fundus score and clinical features and their contribution to the prediction model of DR progression. Features are in descending order by contribution (also known as importance) in the model. Details of associations are shown in a beeswarm plot (right) in which each point represents a participant. Color indicates the value of the feature, with red denoting higher and blue denoting lower. A negative SHAP value indicates negative feature attribution for the prediction of DR progression; a positive SHAP value indicates positive feature attribution for the prediction of DR progression.
Results and discussion
In internal validation, the fundus model was found to perform better than the metadata model, as measured by C-indices, in spite of using low-resolution images. For years 1–5, the fundus model maintained a robust performance across eight external datasets, demonstrating accuracy in predicting specific time to DR progression, as shown by high C-indexes and IBS.
Subgroup analysis showed that DeepDR Plus could effectively predict different types of DR grade deterioration over five years in the three subgroups, achieving improved C-indices and IBS compared to the metadata model.
In the Chinese-cohort-based real-world study, the fundus model could relatively prevent 46.8% DR progression incidence with comprehensive interventions. The Indian cohort-based real-world study showed that using comprehensive interventions, the fundus model could help prevent 88.74% DR progression incidence as compared to the metadata model. If participants in both the IM and non-IM groups adhered to the personalized screening intervals recommended by the fundus model, the average screening interval could be prolonged from 12 months to 31.97 months. Overall, the fundus model could more precisely categorize participants, allowing for personalized interventions and decreasing the frequency of diabetic retinopathy screenings while minimizing delays in detecting progression.
Further analysis showed that the tool's predictions focus on retinal vessels and the fovea, supported by attention maps and quantitative measurements beyond the retinal vascular geometry.
However, the study is limited by the training of DeepDR Plus on a Chinese population, potential intrinsic biases, performance variations with different treatment regimens, and the absence of actual clinical application. This highlights the need for future testing and trials to validate AI-driven DR screening and intervention.
Conclusion
In conclusion, DeepDR Plus, utilizing baseline fundus images, can robustly predict personalized risk and time to progression of DR. Real-world application suggests the potential extension of screening intervals to about 32 months. The findings demonstrate promising integration of the tool into clinical workflows for individualized DR management strategies to improve patient outcomes.
 Popular diabetes drugs do not alter the risk of developing a blinding eye condition