Biotechnology is used to produce a majority of current nutritional and consumer products, and, as a result, the development of innovative methods that enhance production efficiency is attracting a great deal of interest.
Rational strain design is one technique that is used by researchers when they want to enhance the yield of amino acids like arginine - an essential amino acid extensively used by the food, cosmetic, and pharmaceutical sectors.
This article demonstrates a robust method for improving the efficiency of arginine production by a gram-negative bacterium called Corynebacterium glutamicum. This microorganism is used for the biotechnological production of primary metabolites, through a rational strain design as well as a combination of proteomic and metabolomic studies.
Since the Bruker impact II Q-TOF system is suitable for bottom-up metabolomics and proteomic workflows, it was used for acquiring the proteomics and metabolomics data. Mapping the results of both proteomic and metabolic changes onto the biochemical pathways helped in establishing a connection between biology and mass spectrometric data. The study results offer a better understanding of how rational strain design can be applied to improve the efficiency of arginine production. In addition, the workflows described in this article can also be used for studying other biotechnological production systems.
Results
A combination of proteomics and metabolomics studies was used to interpret the changes - induced by the introduction of rational strain design in C. glutamicum - in arginine production. Three varied mutant strains were analyzed, all of which had an effect on the arginine biosynthesis pathway (see Figure 1).
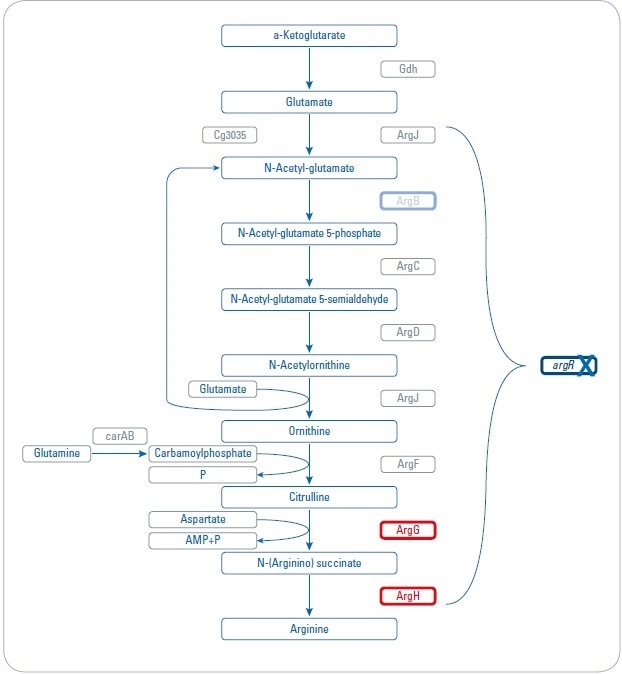
Figure 1. Overview about arginine biosynthesis pathway and analyzed mutant strains. Three different mutant strains (argR, argB, and argGH) influencing different parts of the arginine biosynthesis pathway are investigated to increase arginine production.
- Genes are regulated by the repressor argR, which is activated by arginine
- Repressor deletion mutant (argR): chromosomal deletion of argR
- Feedback-resistant mutant (argB): chromosomal deletion of argR and introduction of feedback-resistant argBfbr alleles. The N-acetylglutamate kinase, which is encoded by argBfb is feedback-regulated by arginine and thus also limits arginine production. Previous studies showed that besides arginine, these strains accumulated significant amounts of citrulline as a by-product, indicating a bottleneck in the pathway.
- Debottlenecking by overexpression (argGH): chromosomal deletion of argR and introduction of feedback-resistant argBfbr alleles as well as debottlenecking of the last two reactions by overexpression of argGH
Data was obtained on the Bruker impact II Q-TOF system using “one-shot data acquisition” of MS and MS/MS spectra from all precursor ions with data-dependent MS/MS using the InstantExpertiseTM routine (see Figure 2).
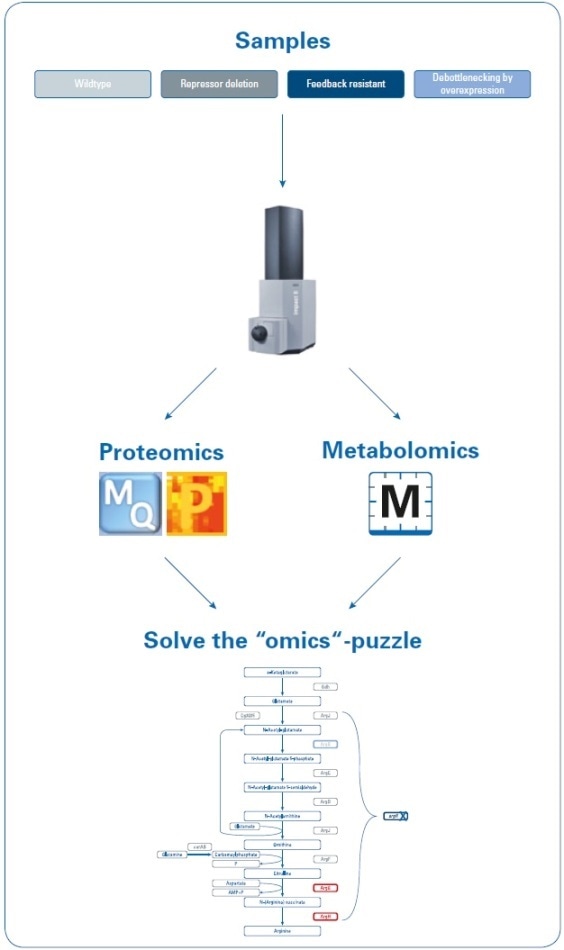
Figure 2. Workflow to investigate the increase in arginine production by rational strain design. Four samples (wild type and three mutant strains) were analyzed using proteomics and metabolomics applications on the impact II Q-TOF instrument. Data were processed using MaxQuant and Perseus (for proteomics studies) or MetaboScape (for metabolomics studies) software, and then mapped onto the biological pathways to visualize the results of the introduced changes.
Metabolomics data processing, such as pathway mapping of metabolite fold changes, statistical analyses, and the automatic identification of known targets, was performed using Bruker’s MetaboScape software. This client-server, workflow-based software automatically and reliably detected a number of known compounds in the arginine biosynthetic pathway, based on user-definable levels for isotopic fidelity, mass accuracy, and retention time. The results, thus obtained, were shown as an “annotation quality”. A more comprehensive description of this non-targeted, high-resolution accurate mass (HRAM) LC-QTOF-based metabolomics workflow has been defined in Bruker Poster Note (PN-26[1]).
The metabolomics data were statistically analyzed, which showed a distinct separation of C. glutamicum wild type (WT) extracts from all three mutant strains through 3D PCA score plots (see Figure 3a). The “debottlenecking by overexpression” (argGH) and the “feedback-resistant” (argB) mutant extracts were observed to overlap in the PCA scores plot. MaxQuant software was used to process proteomics data.[2] Subsequent statistical data evaluation through Perseus software[3] revealed the separation of the WT extract from all three mutant strains in 3D PCA scores plot (see Figure 3b). This established the separation, which was already identified in the metabolomics study. While the metabolomics data demonstrated an overlap of the “debottlenecking by overexpression” and the “feedback-resistant” mutant extracts, all the four different bacterial strains were separated in the proteomics results.
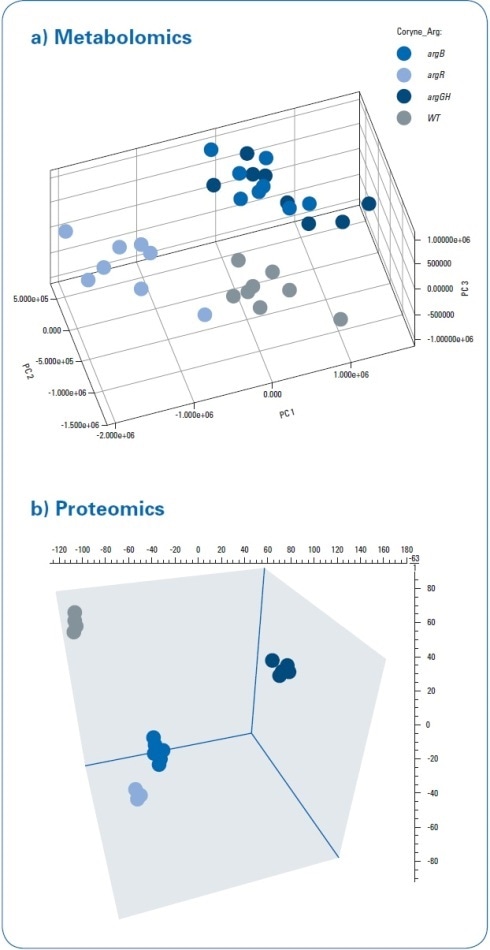
Figure 3. PCA 3D scores for metabolomics and proteomics data processing. A clear separation between the wild type and mutant strains was detected using both approaches. The “feedback-resistant” and the “debottlenecking by overexpression” mutant extracts overlap in the metabolomics PCA scores plot, and they were clearly separated in the proteomics approach.
The proteomics study also demonstrated major changes in proteins involved in the arginine biosynthesis pathway in the “repressor deletion mutant.” Gene deletion of argR must be present in all mutants, leading to the absence of the corresponding protein. As anticipated, the data revealed that the protein can be clearly detected in the WT with eight peptides. A couple of peptides (ELGELLSGR, AA 161–169 and SLGSTPSTPENLN PVTR, AA 2–18) in the mutant lines were also detected. This finding also correlates with the proteome level, because only a partial deletion was genetically engineered in the argR gene, leading to the mutant strain still generating amino acids 1 to 38 and 154 to 171.
Mapping the changes identified in the proteomics and metabolomics onto biochemical pathways resulted in the rapid development of a theory for the observed changes in the biological context. Since the aim was to boost arginine production (see Figure 4), the focus was mainly on the arginine biosynthesis pathway, although changes were also seen for other pathways.
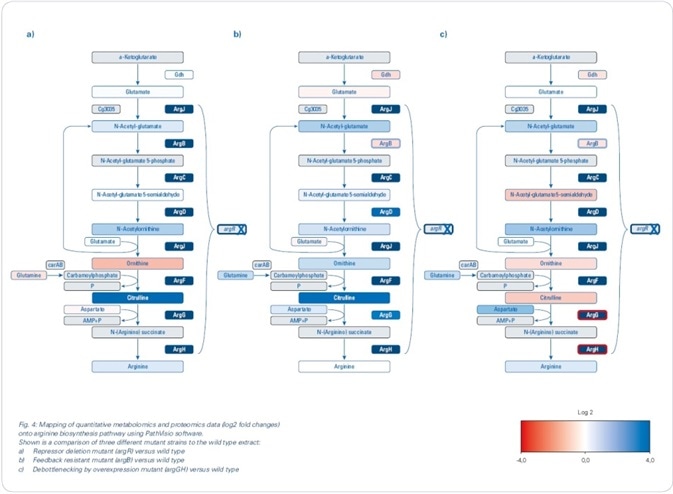
Figure 4. Mapping of quantitative metabolomics and proteomics data (log2 fold changes) onto arginine biosynthesis pathway using PathVisio software. Shown is a comparison of three different mutant strains to the wild type extract: (a) Repressor deletion mutant (argR) versus wild type; (b) Feedback-resistant mutant (argB) versus wild type; (c) Debottlenecking by overexpression mutant (argGH) versus wild type.
Custom pathway maps generated in PathVisio software were used to map log2 fold changes. The genes for arginine biosynthesis are arranged in an operon structure (argCJBDFRGH) and controlled by the repressor ArgR, which is stimulated by arginine, in the WT. Using label-free quantitative proteomics, the repressor deletion mutant was compared with the WT (see Figure 4 a), which clearly revealed an increased abundance of the enzymes involved in the arginine biosynthetic pathway, along with log2 fold changes greater than 3. Although the increased abundance of these enzymes could be anticipated to cause a considerable increase in the production of arginine, metabolomics data showed that the intracellular arginine was not increased merely by the depression of arginine biosynthesis inhibitors.
Since arginine was also secreted into the fermentation broth, there should be increased levels of extracellular arginine. The level of arginine in the fermentation broth was also examined (see Figure 5). The extracellular arginine levels were not detected in the WT and continued to be low with levels of 38 mg/L in the repressor deletion mutant (argR).
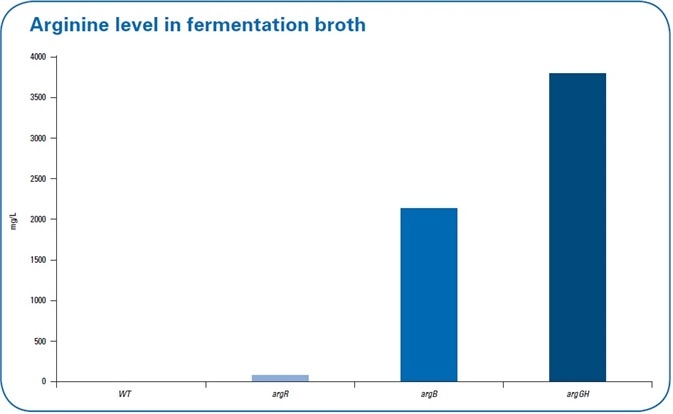
Figure 5. Extracellular levels of arginine in the fermentation broth in the wild type (wt) and the three different mutant strains. The highest levels of arginine in the fermentation broth were detected in debottlenecking by the overexpression mutant.
N-acetylglutamate kinase, encoded by the argB gene, is known to be feedback-regulated by arginine. Since this regulation can restrict the production of arginine, a second mutant comprising of the chromosomal deletion of argR as well as an introduction of a feedback-resistant argB allele was produced and examined (argB). Here, an interesting fact is that when the feedback resistance is introduced, it leads to a decreased abundance of N-acetylglutamate kinase - encoded by the argB gene - in the mutant line when compared to the WT. Upon comparing this feedback-resistant mutant to the WT (see Figure 4 b) for the metabolomics data, there was no increase in the intracellular levels of arginine; however, when determining the extracellular levels of arginine, more than 2 g/L was established - a major increase when compared to the amounts determined for argR deletion mutant and WT (see Figure 5).
Remarkably, when the levels of intracellular metabolite were mapped, an increased level of citrulline was observed, as indicated by the green color-coding in Figure 4b. Such an observation demonstrates a restriction in the last two steps of the pathway beginning from argG/citrulline in the “feedback-resistant mutant.”
A third mutant was developed to possibly “de-bottleneck” the last two reactions of the arginine biosynthesis, and this was done by overexpressing the argGH genes in the “feedback-resistant mutant” background. The use of label-free proteomics revealed an increased abundance of arginosuccinate lyase (ArgH) and arginosuccinate synthetase (ArgG) (see Figure 4c), demonstrating that this overexpression, in fact, resulted in increased abundance of proteins. Simultaneously, this debottlenecking led to lower intracellular levels of citrulline and ornithine. In addition, pathway mapping results revealed that intracellular arginine levels were subtly increased. Most significantly, extracellular arginine levels increased to over 3.5 g/L.
| Metabolomics |
| HPLC |
Dionex™ RSLC™ (Thermo Fisher Scientific) |
| Column |
ZIC™ HILIC 100 × 2.1 mm, 3.5 μm, PEEK, SeQuant (Merck) |
| Flow rate |
0.3 mL/min |
| Mobile phase |
A = water + 0.1% formic acid, B = acetonitrile + 0.1% formic acid |
| Gradient |
t = 0–1 min, 90% B; t = 13 min 2% B; t = 16 min, 2% B; t = 17 min 90% B; t =25 min 90% B |
| Source |
ESI source |
| Ionization |
ESI(+) |
| Mode |
InstantExpertise™ |
| Scan range |
m/z 20–1000 |
| Acquisition rate |
MS: 1 Hz, MSMS: 8Hz |
Methods
Three mutant strains were compared to C. glutamicum WT extracts. Using data-dependent MS/MS methods, both proteomics and metabolomics data were obtained on an impact II Q-TOF MS (Bruker Daltonics) instrument. Metabolomics data were processed using MetaboScape 1.0 software, while proteomics data were processed using MaxQuant software (v. 1.5.2.8). The detected changes to the arginine pathway were mapped in MetaboScape and PathVisio 3.2.0[4, 5] software to better understand the data in a biological context. Since arginine was secreted into the fermentation broth, the extracellular levels of arginine were determined using fluorescence detection.[6]
Sample
Three mutant strains - ΔargR, ΔargR argBfbr, and ΔargR argBfbr pZ8-1::[argGH] - were compared to C. glutamicum WT extracts.
| Proteomics |
| HPLC |
Dionex™ RSLCnano™ (Thermo Fisher Scientific) |
| Column |
Nano Trap Column, 100 μm i.d. × 2 cm, packed with Acclaim PepMap100 C18, 5 μm, 100 Å, nanoViper and Acclaim PepMap RSLC C18, 2 μm, 100 Å, 75 μm i.d.×50 cm, nanoViper (Thermo Fisher Scientific) |
| Flow rate |
400 nL/min |
| Mobile phase |
A = water + 0.1% formic acid, B = acetonitrile + 0.1% formic acid |
| Gradient |
t = 0 min, 2% B; t = 2 min 5% B; t = 90 min, 35% B; t = 100 – 110 min 95% B; t =111 – 125 min 5% B |
| Source |
CaptiveSpray ionization source with nanoBooster (using acetonitrile as dopant) |
| Ionization |
ESI(+) |
| Mode |
InstantExpertise™ |
| Scan range |
m/z 300–1600 |
| Acquisition rate |
MS: 2 Hz, MSMS: 4 – 16 Hz |
| Arginine measurements |
| Derivatization |
o-phthaldialdehyde |
| HPLC |
Smartline Amino acid Analyser (Knauer) |
| Column |
0.3 ACCQtaq 150 x 3.9 mm, 4 μm (Waters) mL/min |
| Mobile phase |
A = 19% methanol in ammonium acetate buffer (pH 7.2), B = 75% methanol in ammonium acetate buffer (ph 7.2) |
| Gradient |
t = 0 – 20 min, 0% B; t = 55 min 100% B; t = 60 min, 100% B |
| Detection |
Excitation: 330 nm, emission: 450 nm |
Conclusions
- Through the integration of non-targeted omics techniques, a better understanding was obtained regarding the changes in C. glutamicum production induced by the rational strain design.
- The results acquired by the impact II Q-TOF system, utilizing the InstantExpertiseTM data-dependent HRAM LC-MS/MS acquisition routine, enabled reliable and accurate identification as well as relative quantitation for the metabolomics and proteomics studies.
- Pathway mapping of the proteomics data distinctly revealed an increased abundance of enzymes involved in arginine biosynthesis in the mutant strains in comparison with the wild type.
- Conversely, the reasons for the presence of bottlenecks in the biosynthetic pathway and the changes in arginine production can only be interpreted in tandem with the metabolomics data, emphasizing the significance of combined proteomics and metabolomics.
References
[1] PN-26: MetaboScape: Linking HRAM QTOF Data to Biology - Increasing Arginine Production in C. glutamicum by Rational Strain Design and Discovery Metabolomics: https://www.bruker.com/fileadmin/user_upload/8-PDF-Docs/Separations_MassSpectrometry/Literature/PosterNotes/PN-26_MetaboScape_Coryne_Arginine_Mutanten_eBook.pdf
[2] Cox, J. and Mann, M. MaxQuant enables high peptide identification rates, individualized p.p.b.-range mass accuracies and proteome-wide protein quantification. Nat Biotechnol, 2008, 26, pp 1367–72.
[3] Tyanova S., et al., Nat Methods, 2016, doi: 10.1038/nmeth.390.
[4] PathVisio 3: An Extendable Pathway Analysis Toolbox Kutmon M, van Iersel MP, Bohler A, Kelder T, Nunes N, Pico AR, and Evelo, CT PLoS Computational Biology (2015) 11(2): e1004085. doi: 10.1371/journal.pcbi.1004085, pubmed: 25706687.
[5] Presenting and exploring biological pathways with PathVisio van Iersel MP, Kelder T, Pico AR, Hanspers K, Coort S, Conklin BR, and Evelo C. BMC Bioinformatics. 2008 Sep 25;9:399. doi: 10.1186/1471-2105-9-399, pubmed: 18817533.
[6] Walter F., et al.; J Biotechnol. 2015, doi: 10.1016.
About Bruker Daltonics
Empowering Science – Improving Life
Bruker Daltonics delivers cutting-edge mass spectrometry solutions and workflows that help scientists and industry leaders tackle real-world challenges and make new discoveries. From life sciences and pharmaceutical research to food and contaminant analysis, environmental monitoring, forensics, and industrial quality control, our technologies and instruments provide the precision and reliability you need to make confident decisions.
Our innovative platforms - such as timsTOF, scimaX, neofleX, and DART-TQ - combined with advanced software like SCiLS™ Lab, MetaboScape®, and Biopharma Compass®, transform complex data into actionable insights. Breakthrough innovations like Trapped Ion Mobility (TIMS), Omnitrap®, and dual ionization GC-HRMS are redefining what’s possible in mass spectrometry.
Trusted by leading research institutes, universities, government agencies, and industrial partners worldwide, Bruker Daltonics is committed to driving scientific progress and delivering solutions that matter.
(For Research Use Only. Not for use in clinical diagnostic procedures).
Sponsored Content Policy: News-Medical.net publishes articles and related content that may be derived from sources where we have existing commercial relationships, provided such content adds value to the core editorial ethos of News-Medical.net, which is to educate and inform site visitors interested in medical research, science, medical devices and treatments.