Measuring the wavelength-specific absorbance of light by cultures over time can provide insights about microbial growth. Bacterial growth curves performed in 96-well microplates using a microplate reader enable simultaneous monitoring of various testing conditions. Additionally, onboard injectors offer an easy method of making experimental additions whose effects on growth can be quantified in real time.
This article demonstrates the use of a SpectraMax® iD3s Multi-Mode Microplate Reader with Advanced Shake and dual injectors for continuously measuring the growth of E. coli cultures over the course of 15 hours. To ensure aeration and nutrient availability, the plate was shaken between absorbance reads.
Glucose or chloramphenicol was injected into a subset of wells using injectors at a selected time point, with growth results observed as kinetic traces shown in the SoftMax® Pro Software.
Benefits
- Optimal growth conditions for microbes can be dialed in thanks to the advanced shake settings
- Reagent addition with continuous growth data generation is possible with onboard injectors
- The workflow editor facilitates setup of complex workflows
Materials
- E. coli, strain JM109
- Growth media, LB Broth (1X) (Thermo Fisher Scientific cat. #10855001)
- Glucose, 1 M stock (Fluka BioChemika cat. #49158)
- Chloramphenicol, 10 mg/mL in ethanol (Thermo Fisher Scientific cat. #J67273.AB). This stock solution was further diluted to 500 ug/mL prior to use.
- Clear 96-well microplate (Corning cat. #3599)
- QPix® FLEX™ Microbial Colony Picker (Molecular Devices)
- SpectraMax® iD3s Multi-Mode Microplate Reader (Molecular Devices) with:
- SoftMax® Pro Software
- Advanced Shake (optional feature)
- Injector system with SmartInject® Technology
Importantly, the SpectraMax iD5e Multi-Mode Microplate Reader provides Advanced Shake and SmartInject technologies that are compatible with similar bacterial growth applications.
E. coli culture and growth-curve generation
E. coli strain JM109 was streaked onto LB agar plates with the help of the QPix FLEX Microbial Colony Picker. Then, a single colony was inoculated into 5 mL of LB broth and grown in a 15 mL culture tube with shaking for 14 to 16 hours at 37 °C, until it reached an optical density at 600 nm (OD600) of around 0.9. For the experiments, overnight culture was subsequently diluted with new LB broth to an OD600 of about 0.1.
After that, 190 μL of this E. coli culture was transferred to each well from B2 to G11 of a clear 96-well microplate. To minimize evaporation of the inner wells, LB broth was injected into the wells along the outer edges of the microplate. Glucose was added to a final concentration of 30 mM to wells in columns four and five. The microplate was then inserted into the SpectraMax iD3s reader.
Using a protocol with workflow set up in SoftMax Pro software, a kinetic read was started, as shown below (see also Figure 1). Injections of glucose (a nutrient) or chloramphenicol (a broad-spectrum antibiotic that blocks bacterial protein synthesis) into replicate wells were configured to take place during the mid-log growth phase of cultures.
Workflow steps
- The system runs 14 cycles, for 3.3 hours total, composed of the following steps:
- Absorbance is read at 600 nm (OD600)
- Shaking for 870 seconds in orbital mode with diameter 2.5 mm and speed 500 rpm (parameters chosen to mirror the settings of a lab shaker)
- Restart from stage (a)
- Following completion of 14 cycles, 6 μL of glucose stock is injected into wells of columns six and seven (final concentration 30 mM).
- The system injects 3 μL of chloramphenicol stock into wells of columns eight and nine (final concentration 7.7 μg/mL).
- The system injects 15 μL of chloramphenicol stock into wells of columns 10 and 11 (final concentration 36.6 μg/mL)
- The system executes 57 cycles for 14 hours total, consisting of the following steps:
- Absorbance is read at 600 nm
- Shaking for 870 seconds in orbital mode with a diameter of 2.5 mm and a speed of 500 rpm
- Restart from stage (a)

Figure 1. Workflow Editor in SoftMax Pro software. This feature was used to set up a kinetic plate read with injections of glucose and antibiotic at specified volumes into designated wells, performed at a selected time. Image Credit: Molecular Devices UK Ltd
Results
SoftMax Pro software was used to generate raw data on bacterial growth from the first plating through the lag and log phases, and on responses to the introduction of glucose or chloramphenicol. This data can be accessed as continuous kinetic traces at all times throughout the workflow (Figure 2).
The whole procedure was scheduled to last 17 hours and 16 minutes, plus approximately one minute for the three injections. It is possible to cancel the workflow run at any moment without losing data generated thus far. In this case, the run was stopped during cycle 46 of step five, at about 15 hours, at which time clear differences were already observed among the different experimental treatments.
For every growth condition examined, formulas were applied to the raw data using the Data Reduction function in SoftMax Pro to determine the maximum OD600 attained during the growth period. This feature was also used to determine the specific time at which the maximum OD600 was attained for each microplate well.
In the control wells, E. coli growth demonstrated a lag phase, followed by a log phase, attaining a maximum OD600 of 1.19 at 12.6 hours (Figure 3A). Cultures to which glucose was introduced immediately before initiating the kinetic read exhibited a dimorphic (two-phase) growth curve, achieving a maximum OD600 of 1.27 at 14.3 hours (Figure 3B).
When glucose was introduced into cultures during the mid-log growth phase, growth became more continuous (monomorphic), reaching an OD600 of 1.33 at 14.7 hours (Figure 3C).
Injecting chloramphenicol caused growth to decrease compared to control cultures. A maximum OD600 of 0.75 was reached at 8.2 hours, followed by a subsequent decline, with a small increase in response to a final concentration of 36.6 μg/mL compared to 7.7 μg/mL (Figure 3D). Figure 4 displays the growth-curve data, decreased to maximum OD600 (A) and time to maximum OD600 (B).
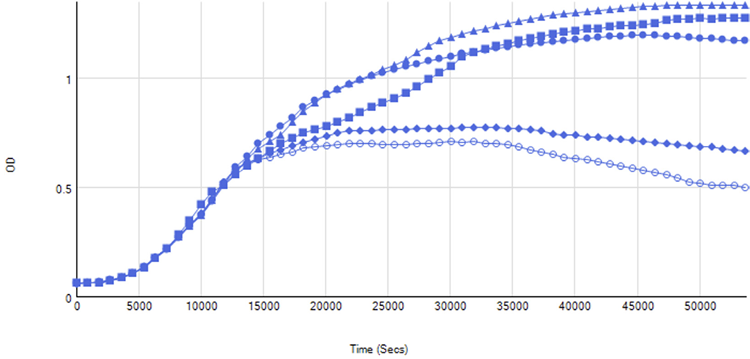
Figure 2. Continuous kinetic traces of E. coli growth. Single representative wells of different growth conditions are shown to illustrate the variation in growth observed. Image Credit: Molecular Devices UK Ltd
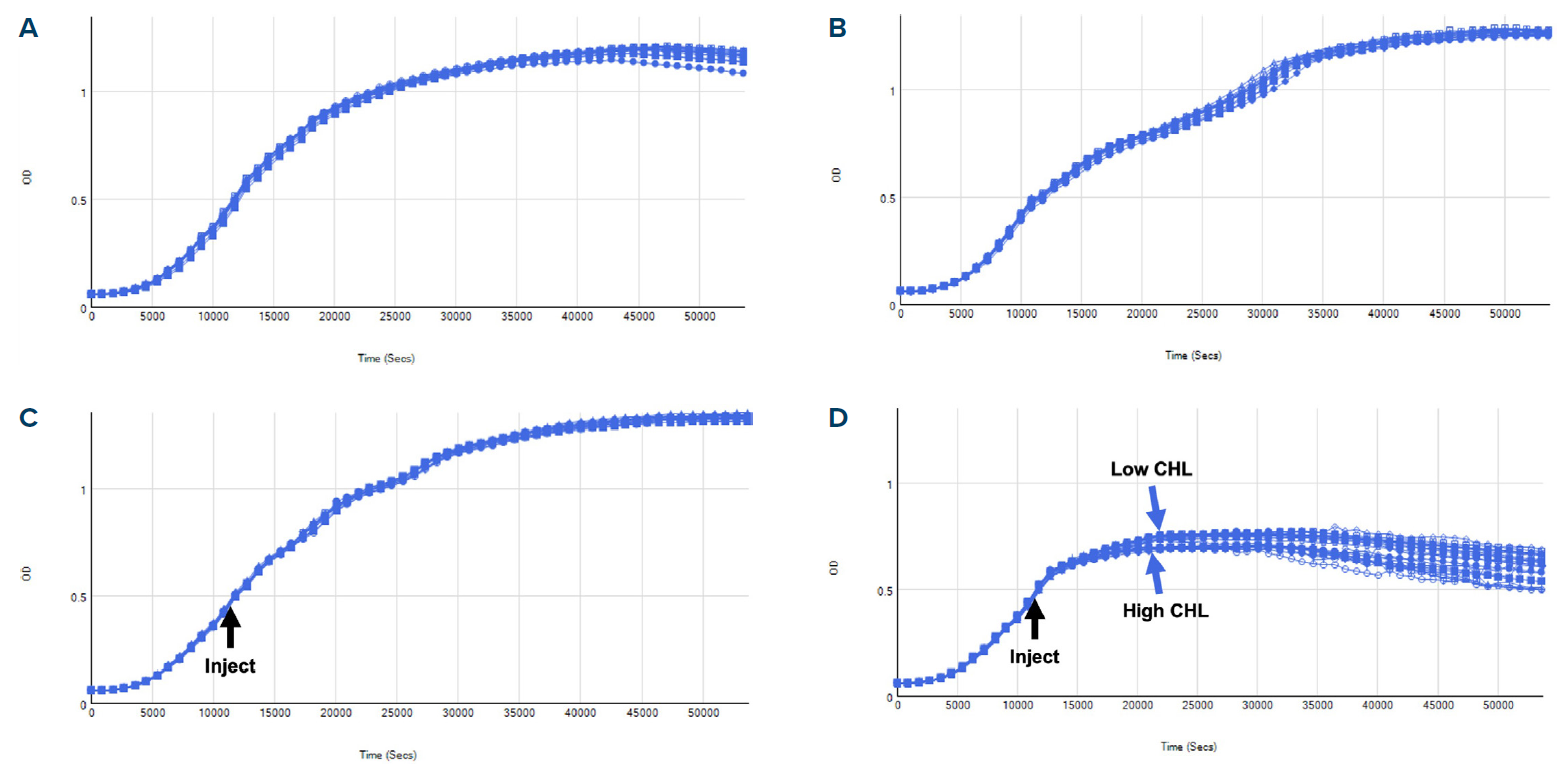
Figure 3. Kinetic traces of replicate wells. A, control; B, glucose added at time zero; C, glucose added by injector at mid-log phase; D, high or low concentration of chloramphenicol (CHL) added by injector at mid-log phase of growth. Image Credit: Molecular Devices UK Ltd
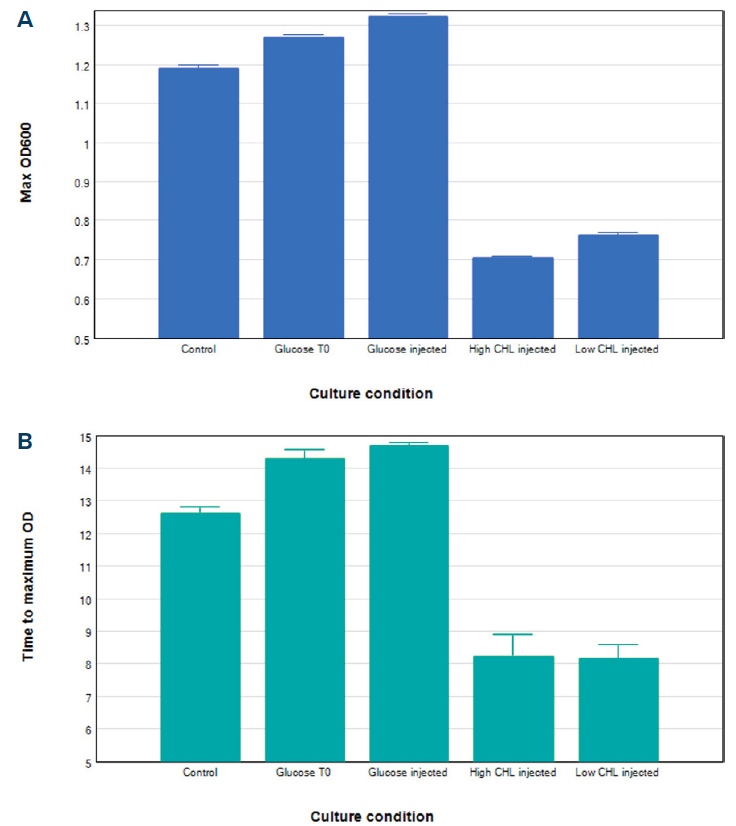
Figure 4. Raw kinetic growth curve data with calculations applied using the data reduction function in SoftMax Pro software. Results for different culture conditions were plotted: A, maximum OD600 reached during the kinetic read; B, time required (hours) to reach maximum OD600. Image Credit: Molecular Devices UK Ltd
Conclusions
At the beginning of bacterial culture (e.g., E. coli), glucose added to LB broth functions as a preferred source of carbon. LB broth itself contains amino acids and peptides from tryptone and yeast extract, which can also be metabolized by bacteria.
Growth continues, starting with phase one, in which bacteria initially consume glucose due to catabolite repression, which inhibits the expression of genes involved in metabolizing other carbon sources. This produces an initial exponential growth phase.
A lag phase of metabolic adaptation follows once the glucose supply has been exhausted. During this period, bacteria halt to reprogram gene expression (e.g., operon activation for amino acid metabolism). This produces an observable dip or plateau in the growth curve. Finally, bacteria proceed to phase 2, when bacterial growth resumes through utilization of amino acids and peptides in LB broth.
This second growth phase is generally somewhat slower than glucose metabolism. The two-phase pattern, known as diauxic growth, has been extensively documented in E. coli grown in media containing glucose alongside alternative carbon sources.1,2
In the present experiment, cultures where glucose was added during the mid-logarithmic phase exhibited a substantially different growth profile from the diauxic-like pattern observed when glucose was present from the beginning. Rather than a biphasic curve with a transient lag, the OD600 trace traced a continuous sigmoidal trajectory.
This suggests that cells already metabolically active on the amino acids and peptides in LB were able to incorporate glucose into central metabolism without undergoing a substantial regulatory reset.
The absence of a lag phase indicates that catabolite repression was less prominent under these conditions, as the transcriptional and enzymatic machinery for alternative nutrient utilization was already active.
Metabolite research supports this explanation: Nanchen et al. (2006) demonstrated that E. coli intracellular fluxes have a non-linear dependence on growth rate, with cells in active log phase maintaining flexible metabolic states.3
Enjalbert et al. (2015) reported that acetate fluxes become substantial after glucose depletion. However, mid-growth glucose addition reduces acetate accumulation, smoothing the metabolic transition.4
Recently, systems-level investigations (Succurro et al., 2019; Karlsen et al., 2023) emphasize that population heterogeneity and timing of substrate availability heavily impact whether a lag develops.5,6
Collectively, these observations explain why adding glucose mid-log generates a smooth S curve: the culture seamlessly incorporates the novel carbon source into a previously mixed substrate metabolism, bypassing the characteristic diauxic growth pause.
Chloramphenicol is a broad-spectrum antibiotic that functions by binding to the 50S ribosomal subunit of bacteria, blocking the peptidyl transferase activity behind peptide bond formation.
By interfering with this essential stage of protein synthesis, it produces a bacteriostatic effect that stops bacterial growth without directly killing the cells. However, it can be bactericidal against specific pathogens at elevated concentrations.
As anticipated, the addition of chloramphenicol to E. coli during the mid-log phase resulted in growth inhibition.
This was demonstrated by the decrease in maximum OD600, which was attained more than eight hours earlier than in control wells. This growth pattern agrees with chloramphenicol’s predominantly bacteriostatic mode of action. A modest but noticeable decrease in maximum OD600 was seen with 36.6 μg/mL chloramphenicol in comparison to 7.7 μg/mL.
Summary
The effects on bacterial growth caused by adding nutrients or antibiotics can be easily visualized using raw kinetic data generated with the SpectraMax iD3s reader and flexible workflow configuration in SoftMax Pro software.
Onboard injectors make it possible to execute more sophisticated tests involving timed additions of reagents while growth data is being produced. In addition, the Advanced Shake function enables users to choose appropriate shaking conditions.
References and further reading
- Monod, J. (1949). The Growth of Bacterial Cultures. Annual Review of Microbiology, 3(1), pp.371–394. DOI:10.1146/annurev.mi.03.100149.002103. https://www.annualreviews.org/content/journals/10.1146/annurev.mi.03.100149.002103.
- Sezonov, G., Joseleau-Petit, D. and D’Ari, R. (2007). Escherichia coli Physiology in Luria-Bertani Broth. Journal of Bacteriology, 189(23), pp.8746–8749. DOI:10.1128/jb.01368-07. https://journals.asm.org/doi/10.1128/JB.01368-07.
- Nanchen, A., Schicker, A. and Sauer, U. (2006). Nonlinear Dependency of Intracellular Fluxes on Growth Rate in Miniaturized Continuous Cultures of Escherichia coli. Applied and Environmental Microbiology, 72(2), pp.1164–1172. DOI:10.1128/aem.72.2.1164-1172.2006. https://journals.asm.org/doi/full/10.1128/aem.72.2.1164-1172.2006.
- Enjalbert, B., et al. (2017). Acetate fluxes in Escherichia coli are determined by the thermodynamic control of the Pta-AckA pathway. Scientific Reports, 7(1). DOI:10.1038/srep42135. https://www.nature.com/articles/srep42135.
- Succurro, A., Segrè, D. and Ebenhöh, O. (2019). Emergent Subpopulation Behavior Uncovered with a Community Dynamic Metabolic Model of Escherichia coli Diauxic Growth. mSystems, 4(1). DOI:10.1128/msystems.00230-18. https://journals.asm.org/doi/full/10.1128/msystems.00230-18.
- Karlsen, E., et al. (2023). A study of a diauxic growth experiment using an expanded dynamic flux balance framework. PLOS ONE, 18(1), p.e0280077. DOI:10.1371/journal.pone.0280077. https://journals.plos.org/plosone/article?id=10.1371/journal.pone.0280077.
- E. coli, strain JM109
- Growth media, LB Broth (1X) (Thermo Fisher Scientific cat. #10855001)
- Glucose, 1 M stock (Fluka BioChemika cat. #49158)
- Chloramphenicol, 10 mg/mL in ethanol (Thermo Fisher Scientific cat. #J67273.AB). This stock solution was further diluted to 500 ug/mL prior to use.
- Clear 96-well microplate (Corning cat. #3599)
- QPix® FLEX™ Microbial Colony Picker (Molecular Devices)
- SpectraMax® iD3s Multi-Mode Microplate Reader (Molecular Devices) with:
-
- SoftMax® Pro Software
- Advanced Shake (optional feature)
- Injector system with SmartInject® Technology
Note: The SpectraMax iD5e Multi-Mode Microplate Reader also offers Advanced Shake and SmartInject technology and can be used for similar bacterial growth applications.
Acknowledgments
Produced from materials originally authored by Cathy Olsen, PhD, Senior Application Scientist at Molecular Devices, and Sushmita Sudarshan, PhD, Application Scientist, Assay Development, at Molecular Devices.
About Molecular Devices UK Ltd
Molecular Devices is one of the world’s leading providers of high-performance bioanalytical measurement systems, software and consumables for life science research, pharmaceutical and biotherapeutic development. Included within a broad product portfolio are platforms for high-throughput screening, genomic and cellular analysis, colony selection and microplate detection. These leading-edge products enable scientists to improve productivity and effectiveness, ultimately accelerating research and the discovery of new therapeutics. Molecular Devices is committed to the continual development of innovative solutions for life science applications. The company is headquartered in Silicon Valley, California, with offices around the globe. For more information, please visit www.moleculardevices.com.
Sponsored Content Policy: News-Medical.net publishes articles and related content that may be derived from sources where we have existing commercial relationships, provided such content adds value to the core editorial ethos of News-Medical.net, which is to educate and inform site visitors interested in medical research, science, medical devices and treatments.