Bruker’s fragment-based screening (FBS) tool included in TopSpin and the Mnova Suite together provide a comprehensive workflow for NMR-based ligand screening, from data acquisition and processing to advanced analysis, visualization, and reporting.
Automation is available to run and process standard experiments in TopSpin , which works seamlessly with the Mnova Suite in a unified workflow. Mnova Suite’s unique multiple-spectra display and scaling capabilities ensure that hit identification is both rapid and straightforward. Together, TopSpin and Mnova provide a turnkey solution while also allowing user interaction at any stage.
Fragment screening has become a widely applied method for the discovery and optimization of lead molecules throughout the pharmaceutical industry. Appropriate screening methods are required to detect binding ligands, though weak binding affinities in the μM to mM range are a widely observed characteristic of fragments.
NMR-based fragment screening (FBS) is one of the most widely used and dependable techniques, utilized in over 50% of screening campaigns. Data handling and analysis have been a bottleneck, however, because the operator must analyze many 1D 1H or 1D 19F spectra in parallel. Bruker now facilitates these time-consuming tasks with a full TopSpin FBS-Mnova Suite based integrated workflow solution.
This workflow offers a range of benefits, including:
- NMR-based fragment screening is significantly simpler.
- Standard NMR screening experiments can be automated and are automatically recognized in the Mnova Suite , including Water-LOGSY, STD, and T2/T1ρ.
- Both acquisition and analysis can be customized at various steps.
- Acquisition, data processing, and analysis are included in a single seamless workflow.
- Relevant data is automatically displayed, including screening experiment, compound IDs, reference spectra, and cocktail composition.
- Screening studies are saved in projects and organized.
- Users’ actions can be saved within a project automatically and on the fly.
- Reporting is available in various formats.
Complete workflow solution in TopSpin FBS - Mnova Suite
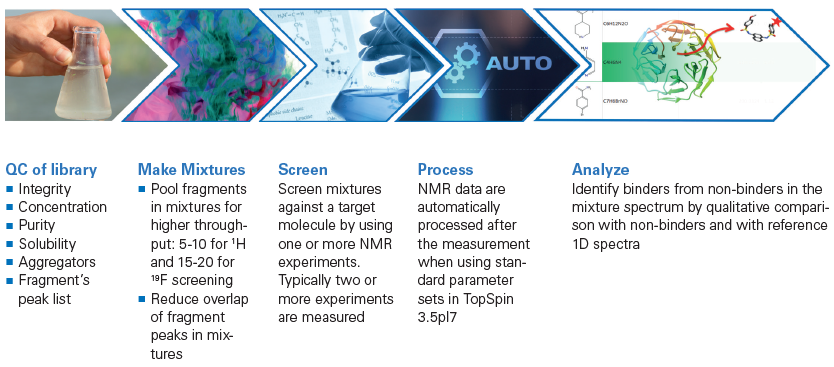
Image Credit: Bruker BioSpin Group
Fragment library quality control
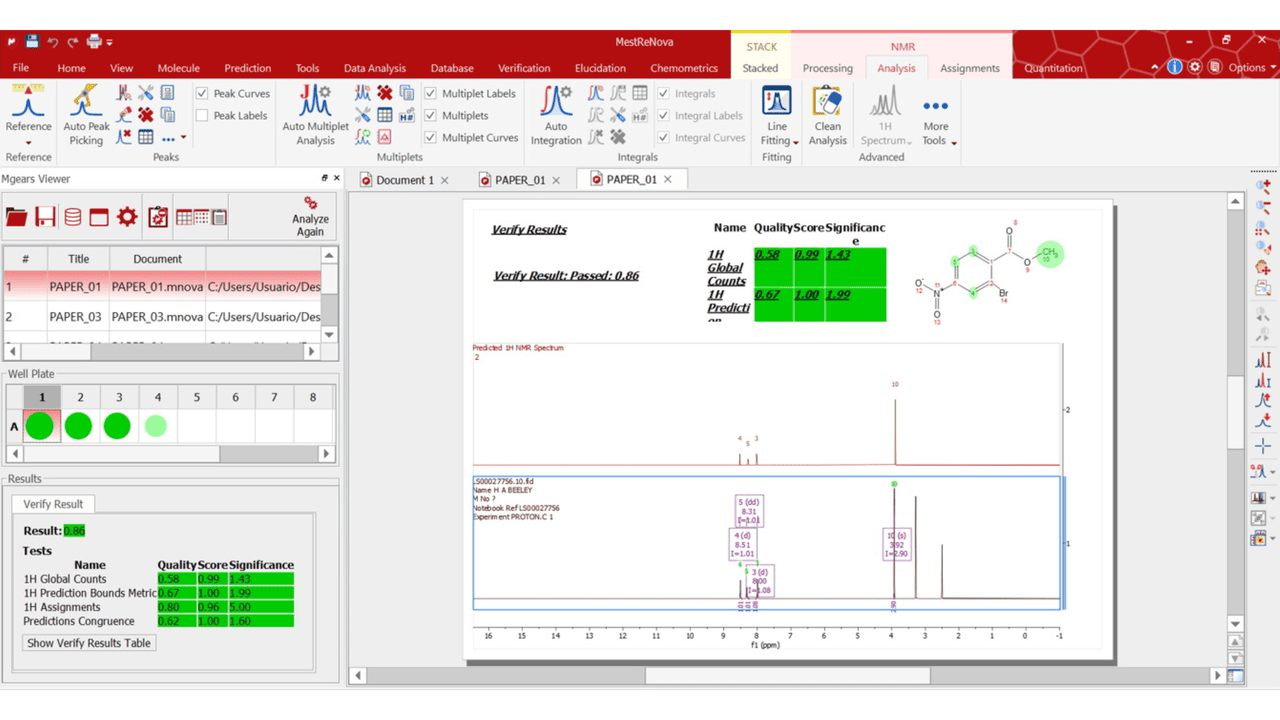
Mnova Verify, part of the Mnova Suite, supports full automation through both batch and real-time execution, allowing large volumes of samples to be processed with minimal intervention. Integrated with Mnova Gears, these automated workflows ensure consistent processing, faster cycle times, and seamless integration into existing laboratory pipelines, from synthesis to QC. Results are presented in a color-coded dashboard that highlights exceptions, enabling chemists to focus only on samples that require review and dramatically reducing the time spent on manual checking. Image Credit: Bruker BioSpin Group
Make mixture
Fragments are pooled into cocktails and screened against the targets to increase NMR screening throughput. These cocktails generally contain 5 to 10 fragments for 1H and 15 to 20 fragments for 19F screening.
The cocktail design is performed once for all screening experiments, taking care to reduce the overlap between the fragments’ peaks in the mixture’s 1H or 19F spectrum. It is possible to readily obtain the fragment’s peak list from quality control and use it to design cocktails with minimal peak overlay.
Hundreds of spectra must be measured, processed, and validated to check the quality of a commercial fragment library or design a new library altogether. The outcome is a fully characterized and quantified selection of fragments, with reference spectra named by their compound ID. These libraries will then be ready for further use in hit identification in mixtures.
The library quality control is a comprehensive workflow solution designed to enable automatic NMR-based quality assurance in batches. There are a few hundred compounds in a typical fragment library, and data acquisition is performed in a 96-well plate format using the SampleJet sample changer and the TopSpin FBS software. The acquired spectra are then automatically analyzed by the Mnova Suite.
Quality assurance involves:
- A consistency check to ensure compound integrity
- A concentration check using a single external reference for all compounds
- A purity estimation using a 100% method
- A comparison of solubility involving the actual and expected concentration
- Utilizing aggregators because their NMR signal is significantly reduced
- Checking the spectra of fragments in buffer with automated solvent suppression
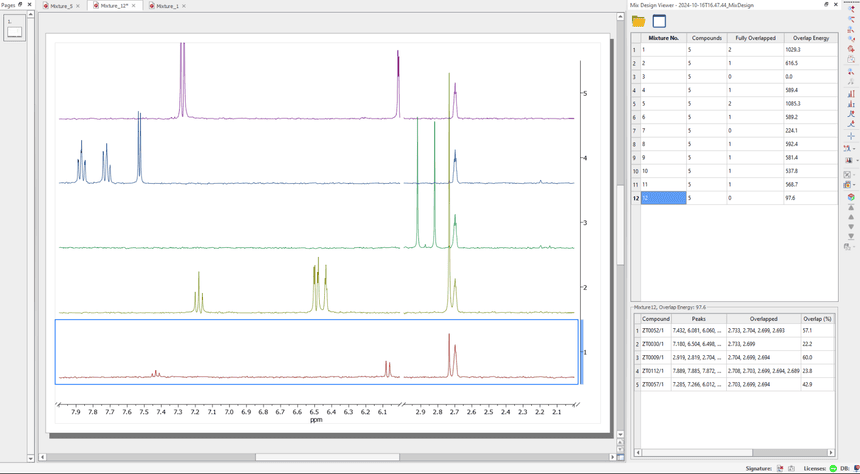
Mix Design automatically creates compound mixtures with minimal NMR signal overlap, enabling efficient pooling strategies for fragment screening. By reducing spectral complexity before data acquisition, reliable hit identification and mixture deconvolution become faster and more robust. Image Credit: Bruker BioSpin Group
Screen and analyze
TopSpin includes ready-to-use parameter sets for screening mixtures against a target molecule. SCREEN_WLOGSY provides a 1D Water-LOGSY experiment, while SCREEN_STD and SCREEN_T1R provide pseudo-2D STD- and T1ρ-based experiments. SCREEN_T2 uses a pseudo-2D CPMG-based sequence, and SCREEN_19F_T2 provides the corresponding experiment for ¹9F-labelled ligands. These standard experiments are designed for ease of use and automated execution, with typically two or more experiments used for ligand-binding determination in FBS.
Protein samples in near-physiological buffer, prepared with or without a small-molecule ligand, are queued under cooled conditions at approximately 4 °C using SampleCase Cooled or SampleJet. TopSpin FBS controls the automated measurements, after which the acquired data is stored and transferred to the Mnova Suite for analysis.
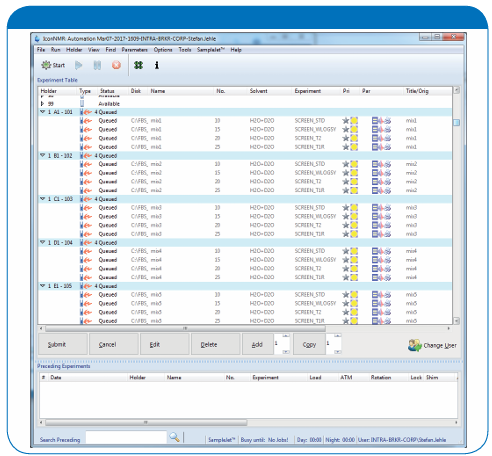
In this example, TopSpin FBS is running the four standard screening experiments for each of the 61 cocktails in the presence of the target. Image Credit: Bruker BioSpin Group
Process
Experimental data is automatically and consistently processed for all screened mixtures:
- Water-LOGSY data is processed with the same phase, meaning that binders always show with the same sign from one mixture to another.
- STD spectrum data is phased using the phase of its reference spectrum, resulting in a significantly improved signal-to-noise ratio.
Screening data review, organization, and transfer for automated hit analysis
The built-in TopSpin fragment screening tool (FBS) provides a dedicated view of screening data for manual review. Within the screening window, users can inspect the spectra, visualize the composition of each cocktail, and locate the signals assigned to individual fragments. FBS organizes the screening data for subsequent automated hit analysis in Mnova Screen. In Mnova Screen, the Results Editor presents the status of each ligand across all experiments and can display additional results, including average or maximum changes in peak integrals, the percentage of matched peaks, and ligand names. The corresponding spectral document can be opened for visual inspection in single or stacked views.
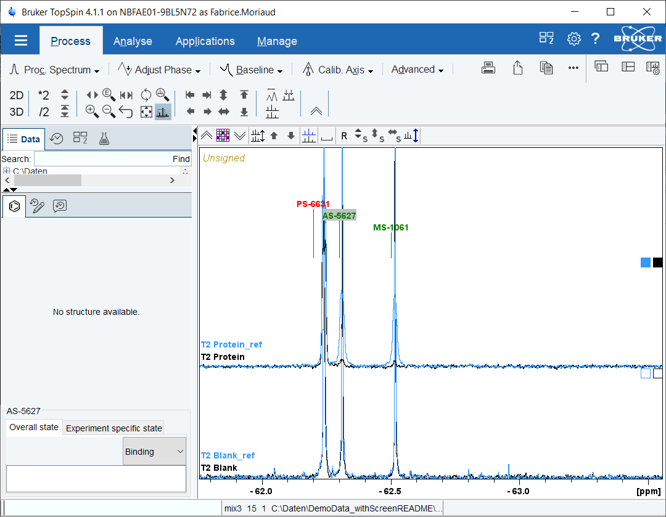
Figure 1. TopSpin FBS view of screening spectra for manual review.
The screening window provides links to visualize cocktails and the localized fragment signal:

In FBS, the data is organized and it can be exported in a format that Mnova Screen can use as input, removing the need to create input configuration which can be a lot of work and a source of errors. Mnova Screen software is ready for automated hit analysis.
Hit Identification
Screening data and reference spectra are organized in the context of the cocktails in the Mnova Suite. A single click in the mixture table allows data related to a given fragment or mixture to be visualized, with spectra displayed in Mnova’s multiple-spectra display.
It is possible to scale or translate spectra up/down and left/right. The hit identification is rapid and straightforward, allowing a visual inspection of all relevant data in a single window. The user can also review, identify and annotate hits.
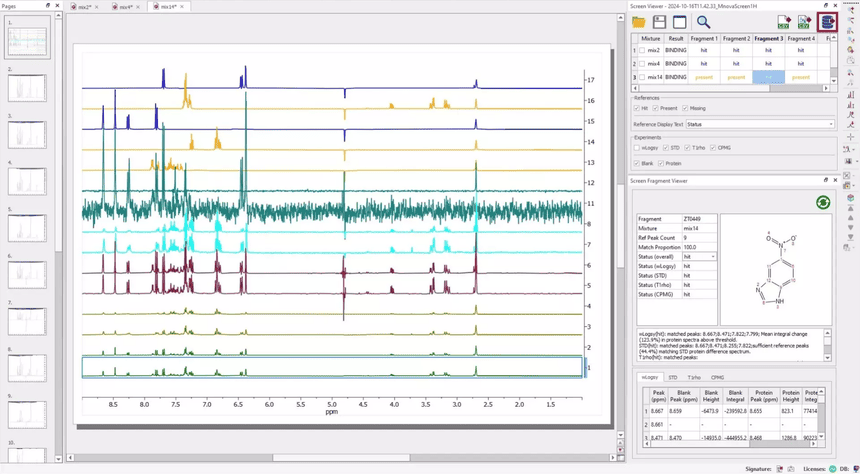
In this example, a mixture was clicked, and the corresponding display in Mnova is obtained. The reference spectra of the five fragments of this cocktail are retrieved automatically and displayed. They are followed by the screening experiments WATER LOGSY, T2, and STD. Hits are detected automatically. Image Credit: Bruker BioSpin Group
Affinity
The Mnova Suite organizes 2D NMR titration data across the ligand concentration series, enabling rapid visualization and analysis of binding-induced spectral changes. Overlaying 2D spectra enables rapid visualization of chemical shift perturbations, allowing binding to be monitored directly at the residue level and supporting confirmation of the ligand binding site. The software tracks peak positions across the titration, automatically calculates CSP values, and generates binding curves for automated Kd determination. This streamlined workflow facilitates the identification, validation, and quantitative characterization of ligand-protein interactions in a single environment.
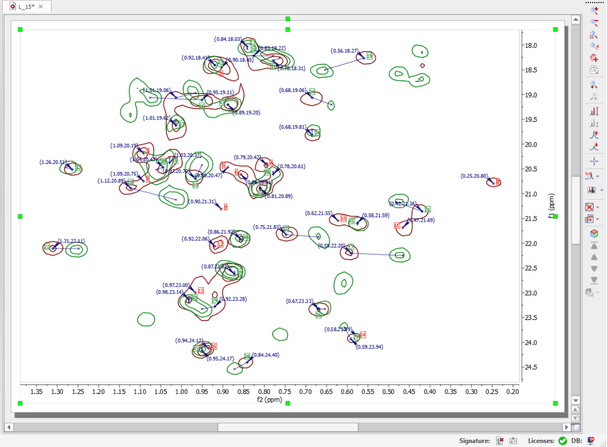
Overlay of heteronuclear 2D NMR spectra acquired during a ligand titration experiment. Peak shifts between spectra reveal chemical shift perturbations associated with ligand binding and enable residue-specific mapping and confirmation of the binding site. Image Credit: Bruker BioSpin Group
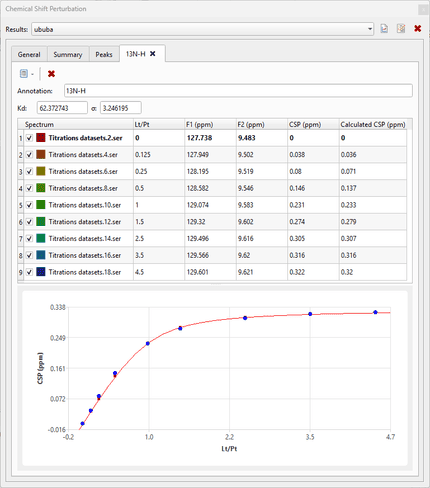
Automated analysis of chemical shift perturbation data in Mnova Suite. Tracked peak positions are converted into CSP values and fitted to a binding model, providing automated Kd determination and quantitative characterization of ligand-protein interactions. Image Credit: Bruker BioSpin Group
Cooled SampleJet: The versatile high-throughput sample changer
The SampleJet is the only NMR automation system that supports 96-well NMR tubes.
This distinct capability makes the SampleJet compatible with standard liquid-handling lab-automation devices, enabling a continuous automation workflow in the microwell plate format ranging from sample preparation to NMR measurement and later sample processing.
The SampleJet can accommodate up to 480 NMR samples in five 96-well racks; each individual rack can be set to a temperature between 4 °C and 44 °C. This means that chilled biological samples can be simultaneously measured in aqueous buffer while compounds are dissolved in DMSO.
As well as operating in batch mode, the SampleJet can accommodate sequential single-tube submission for open-access routine NMR.
A total of 96 open-shop positions are available for four- and seven-inch tubes without a spinner, and three positions are available for seven-inch tubes with a spinner. This allows the system to accommodate a total of 579 samples.
A range of tube sizes is available, with 3 mm and 1.7 mm tubes for sample volumes of 170 µl and 37 µl, respectively, proving to be the most common sizes for fragment screening. This low sample volume allows the screening of mass-limited targets.
Key features of the SampleJet include:
- Five positions for NMR tube racks in 96-well format, meaning that batches of up to 480 sample tubes can be accommodated
- Compatibility with spinner-free open access applications, with 96 spinner-free tube positions plus three positions for tubes with spinners
- Ability to accommodate the most common sample tube diameters, including 5 mm (550 µl), 3 mm (170 µl), 1.7 mm (37 µl), and 1 mm (8 µl)
- Automatically recognized tube diameters, allowing the appropriate spinner to be selected
- Automatic rack and tube barcode identification
- Compatibility with the majority of Bruker BioSpin magnets and spectrometer lines
- Packaged with the TopSpin and IconNMR™ control software
- Individual temperature control between 4 °C and 44 °C for each 96-well rack, allowing many different applications to be run in parallel
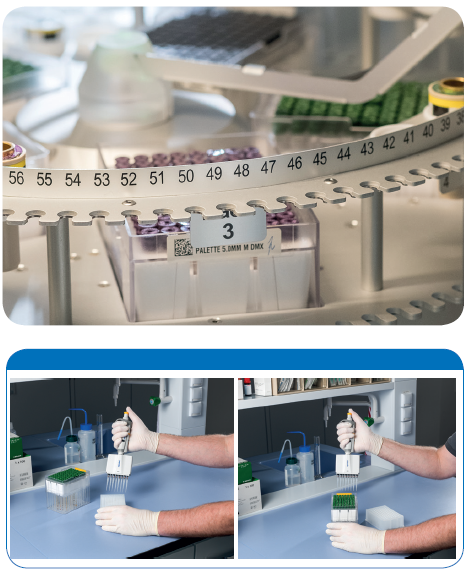
The SampleJet’s 96-tube rack is compatible with standard liquid-handling equipment for sample preparation. Image Credit: Bruker BioSpin Group
The SampleJet features new temperature control options, including:
- The capacity to hold five racks with 96 tubes each
- Automatically recognized tube diameter
- Standard 96-well format
- No spinner required
NMR tube diameters include 1.0, 1.7, 3, and 5 mm tubes with sample volumes of 8, 37, 170, and 550 µl, respectively.
Individual temperature control is available for each of the five 96-sample racks, enabling:
- QC and reference 1D in buffer
- QC of DMSO stock solution
- Protein-containing screening samples
CryoProbes
All of Bruker Biospin’s CryoProbes have been designed with a cryogenically cooled preamplifier for the deuterium channel. This ensures the highest sensitivity for the lock channel, guaranteeing excellent spectrometer stability.
600 MHz or 500 MHz
Every probe option is available for 500 and 600 MHz NMR systems. It is important to note that sample throughput listed in Table 1 is for a 600 MHz system, while a 500 MHz system’s throughput is at least 50% lower.
TCI helium-cooled CryoProbe
The TCI CryoProbe is a proton-optimized triple-resonance NMR ‘inverse’ probe that incorporates three fully independent channels and a lock channel.
It offers the highest sensitivity for 1H detection, making it ideally suited for 1H observed fragment screening. It is important to note that 19F observed screening is also possible, provided simultaneous 1H decoupling is not implemented.
QCIF helium-cooled CryoProbe
The QCIF CryoProbe represents the most flexible fluorine-optimized quadruple-resonance NMR 1H-optimized probe. Four fully independent channels are included, as well as a lock channel.
This allows 1H-decoupled 19F detection to be performed, which is ideal for screening 19F fragment libraries such as 3-FABS and FAXS. The probe also allows simultaneous decoupling on multiple nuclei, such as 13C, 15N, and 19F.
TCI helium-cooled MicroCryoProbe™ for small volume applications
The 1.7 mm TCI MicroCryoProbe™ from Bruker Biospin is the ultimate commercially available tool, offering unparalleled mass sensitivity and the highest 1H sensitivity using only a 37 µl sample volume.
This major jump in sensitivity makes the 1.7 mm Micro-CryoProbe an ideal tool for any NMR analysis application working with limited sample amounts, for example, natural products and mass-limited proteins.
This probe has since been the only means of acquiring spectra of many real-world samples, allowing difficult problems to be solved. For example, it has enabled the screening of thousands of compounds with reduced target and compound quantities, and biological samples where only small quantities are expressed.
All of these applications have seen clear benefits when utilizing the 1.7 mm TCI MicroCryoProbe.
TCI CryoProbe™ Prodigy
The CryoProbe™ Prodigy offers major sensitivity improvements at moderate investment costs versus room-temperature (RT) probes
The TCI Cryo-Probe Prodigy leverages nitrogen-cooled RF coils and pre-amplifiers to deliver a sensitivity improvement of a factor of two for 1H over RT probes.
Siting the probe is simple because the Prodigy package includes a control unit and a liquid nitrogen vessel as well as the probe itself. These powerful features mean that the Prodigy has the potential to become the probe of choice for routine academic and industrial labs.
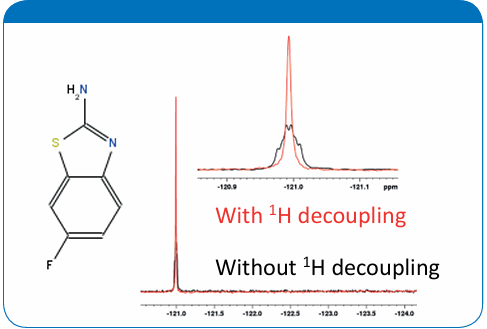
1H decoupling significantly improves signal to noise in 19F spectra. Image Credit: Bruker BioSpin Group
Source: Bruker BioSpin Group
| Table 1 |
TCI |
QCIF |
TCI micro |
TCI Prodigy |
| Observable nuclei |
1H, 19F, 13C, 15N |
1H, 19F, 13C, 15N |
1H, 13C, 15N |
1H, 19F, 13C, 15N |
1H decoupling during
19F acquisition |
No |
Yes |
- |
No |
| Protein observed (HSQC) |
Yes |
Yes |
Yes |
Yes |
| Typical throughput 1H (samples/compounds per day at 600 MHz)* |
100/500–1000 |
70/350–700 |
25/125–250 |
50/250–500 |
| Throughput 19F (samples/compounds per day at 600 MHz)** |
60/1200–1800*** |
90/1800–2700 |
- |
35/700–1050*** |
| Recommended tube sizes |
|
3 mm (170 µl)
5 mm (550 µl) |
1.7 mm (37 µl) |
3 mm (170 µl)
5 mm (550 µl) |
* at 0.2 mM compound concentration per sample and mixtures of five to 10 compounds in 3 mm tubes (170 μl) except TCI micro, for which 1.7 mm tubes (37 μl) are assumed
** at 0.02 mM compound concentration per sample and mixtures of 20–30 compounds in 3 mm tubes (170 μl)
*** 19F spectra without 1H decoupling will show multiplets where 19F is coupled to 1H; this decreases the sensitivity and may result in line broadening
About Bruker BioSpin Group
The Bruker BioSpin Group designs, manufactures, and distributes advanced scientific instruments based on magnetic resonance and preclinical imaging technologies. These include our industry-leading NMR and EPR spectrometers, as well as imaging systems utilizing MRI, PET, SPECT, CT, Optical and MPI modalities. The Group also offers integrated software solutions and automation tools to support digital transformation across research and quality control environments.
Bruker BioSpin’s customers in academic, government, industrial, and pharmaceutical sectors rely on these technologies to gain detailed insights into molecular structure, dynamics, and interactions. Our solutions play a key role in structural biology, drug discovery, disease research, metabolomics, and advanced materials analysis. Recent investments in lab automation, optical imaging, and contract research services further strengthen our ability to support evolving customer needs and enable scientific innovation.
Sponsored Content Policy: News-Medical.net publishes articles and related content that may be derived from sources where we have existing commercial relationships, provided such content adds value to the core editorial ethos of News-Medical.net, which is to educate and inform site visitors interested in medical research, science, medical devices and treatments.