Traditional Quality Control (QC) methods are reactive. They lack integration between software and hardware, and are not standardized, which can lead to compromised data quality and integrity.
The QSee™ Performance Test is a semi-automatic solution for routine system checks and monitoring of timsTOF platforms. It includes specific consumables, verified techniques, and automated reporting.
Here, we introduce the QSee™ Performance Test, describe its implementation, and provide examples to highlight the benefits of a system-focused QC workflow for routine and long-term performance monitoring.
Introducing the QSee™ Performance Test
High-resolution LC-TIMS-MS platforms have transformed small-molecule analysis by delivering unprecedented sensitivity, speed, selectivity, and structural insights via collisional cross-section (CCS) measurements and ion-mobility-cleansed MS/MS spectra.
These advantages, however, are reliant on the instrument continually operating at peak performance. In metabolomics and lipidomics research, dependable analytical performance is critical for maintaining data integrity and extracting significant biological insights.
Reproducibility is equally important. Without it, inter-laboratory evaluations and consistent outcomes cannot be attained across research. The complexity of biological materials, as well as the demands of high-throughput contexts such as clinical research, frequently challenge reproducibility.
QC strategies for mass spectrometry exist, but their execution is often fragmented, manual, and reactive. As a result, issues such as instrument drift, contamination, or hardware malfunctions may only be discovered after data collection, leading to costly reruns, data loss, or compromised study results.
To address these issues, the QSee Performance Test takes a proactive, standardized approach to system monitoring.
It uses a predetermined combination of synthetic standards, specialized LC columns, and automated data evaluation to provide repeatable performance checks with minimal human effort.
The integration with Bruker's TwinScape™ allows for long-term surveillance of LC-MS system stability and variability. This allows researchers to uncover instrument drift or contamination before it affects analytical results.
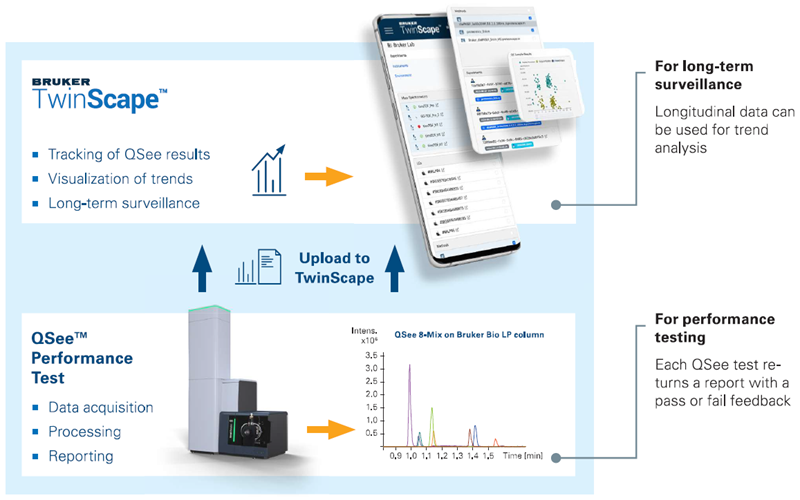
Figure 1. Workflow scheme of the QSee Performance Test solution. The QSee Performance Test integrates standardized procedures for sample preparation, short LC gradients, automated data acquisition, software-driven evaluation of key parameters in 4D workflows, and automated reporting to deliver a comprehensive system-performance assessment for LC-TIMS-MS platforms. Results are automatically uploaded to the digital repository TwinScape for longitudinal analysis. Image Credit: Bruker Daltonics
This article presents the principles that underpin the QSee Performance Test solution, outlines its process, and demonstrates its impact on data quality in metabolomics and lipidomics research.
QSee has been validated across various laboratories and platforms, demonstrating its reliability as a tool for ensuring data quality in real-world metabolomics applications.
Methods
Instrumentation and setup
Table 1 shows the instrumentation provided by the Qsee™ Performance Test program. The workflow was tested with various instrument configurations, including varied combinations of LC and MS systems.
QC sample: QSee™ 8-Mix
The QSee™ 8Mix is a synthetic reference mixture composed of eight chemicals (Table 2).
It is dissolved in water and supplied in ready-to-use aliquots stored at -20 °C. Each QSee™ test run uses a single aliquot, with triplicate injections in both positive and negative ion modes.
Chromatographic conditions
The LC and MS acquisition parameters are provided as preset method sets. Table 3 lists the appropriate parameters. Chromatographic separation is performed using Bruker reversed-phase columns, namely Bruker Bio-AQ (C18 material, recommended for 4D-Metabolomics) and Bruker Bio-LP (C8 material, suggested for 4D-Lipidomics).
Five-minute LC gradients allow for quick runs while maintaining enough LC resolution for performance measurement. To collect MS and MS/MS data, optimal prm-PASEF® (parallel reaction monitoring) methods are used.
Running the QSee performance test
The graphical user interface of the QSee Performance Test Software takes the user through the workflow in three successive steps (Figure 2):
- Collection of essential data in 1. Checklist
- Definition of sequence in 2. Batch setup
- Examination of results in 3. Reporting
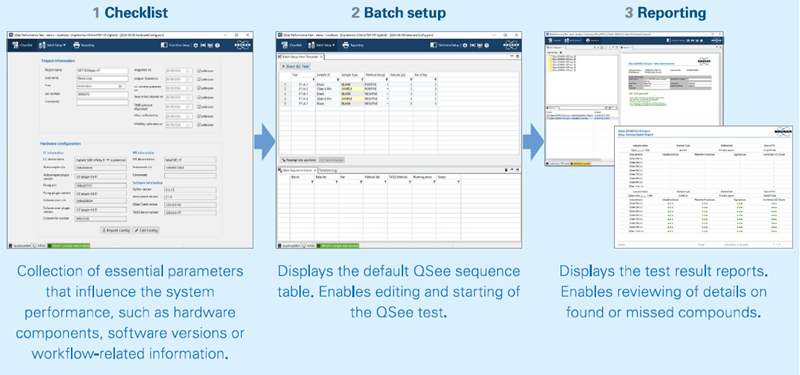
Figure 2. The graphical user interface of the QSee Performance Test offers three perspectives to guide the user through the workflow. Image Credit: Bruker Daltonics
The checklist allows users to provide file names and choose the appropriate instrument configuration and acquisition software. Each QSee test batch contains 15 injections, which cover samples and blanks in both polarities. A comprehensive test runs for about 90 minutes in total.
The QSee™ 8-Mix automatically evaluates and reports on the following parameters for each compound
- Collisional cross section (CCS error)
- Retention-time deviation (RT error)
- mSigma (isotopic-pattern quality)
- Mass accuracy (m/z error)
- Peak area
The QSee™ software generates an overview report from the collected data, with clear pass/fail comments for each parameter. A second, more extensive report can be used to evaluate individual peak parameters across the test batch, which are displayed in an easy-to-understand traffic-light grade.
QSee™ results can be uploaded to TwinScape immediately, allowing longitudinal monitoring and trend analysis of one or more systems within a laboratory.
Usefulness of QSee shown in field tests
The real-world examples below demonstrate QSee™'s ability to proactively detect system anomalies, maintain data integrity, and assure repeatability across platforms and studies.
Data was collected over a 12-month period from several labs and LC-TIMS-MS platforms. The successful application of QSee testing in these labs demonstrates its value as a reliable, proactive quality-control tool for metabolomics researchers.
1. lon source contamination detection
The automatic assessment detected a significant decrease in peak regions across numerous compounds in the QSee™ 8-Mix. TwinScape validated a progressive drop in QSee compound peak regions after numerous QSee runs (Figure 3).
The root cause of the instrument's failure was determined to be ion-source contamination. Following cleaning, signal intensities returned to normal levels, showing both the problem and the efficiency of the early intervention.
Impact: Using the proactive QSee™ technique and taking quick corrective action (source cleaning) saved important samples and staff time that would have been wasted attempting to rescue a low-quality dataset.
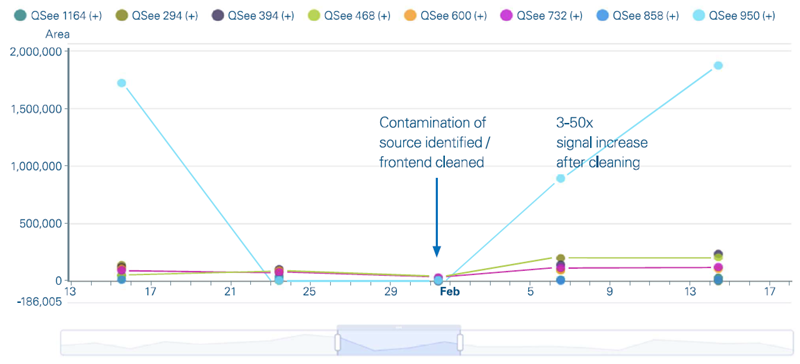
Figure 3. Manual review of peak area trends for QSee 8-Mix compounds in TwinScape over five test runs. While the peak areas declined over time, they returned after proactive source cleaning. Image Credit: Bruker Daltonics
2. LC pump leak identification
In two consecutive QSee™ runs, all QSee™ standards showed a modest increase in retention time (RT). Manual TwinScape trend analysis (Figure 4) demonstrated a progressive increase in RT inaccuracy, requiring a hardware inspection.
A minor leak in pump B was detected and repaired by replacing a check valve. The retention times eventually reverted to their predicted values.
Impact: Early discovery prevented additional RT instability and possible damage to the LC pump. The corrective intervention ensured consistent chromatographic performance in subsequent analyses, a necessary condition for effective, automated data processing.
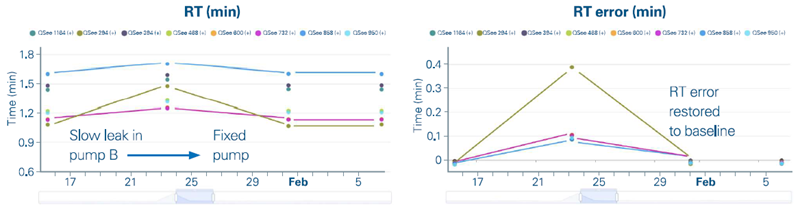
Figure 4. Manual review of the QSee 8-Mix retention times and errors over a period of about a month. The retention times deviated due to a leak in the LC, but returned to expected values after the leak was fixed. Image Credit: Bruker Daltonics
3. Climate control failure
TwinScape detected excessive instrument temperatures during a multi-day batch run, as indicated by hardware readback measurements (Figure 5).
These temperature discrepancies were manually linked to a malfunction in the laboratory's climate control system. Although there was no immediate data loss, and QSee confirmed that data quality was unaffected, this occurrence demonstrated the significance of monitoring environmental parameters as part of routine quality-control operations.
Impact: TwinScape's ability to track hardware parameters alongside analytical measurements provides an important layer of operational safety and enables guided troubleshooting.
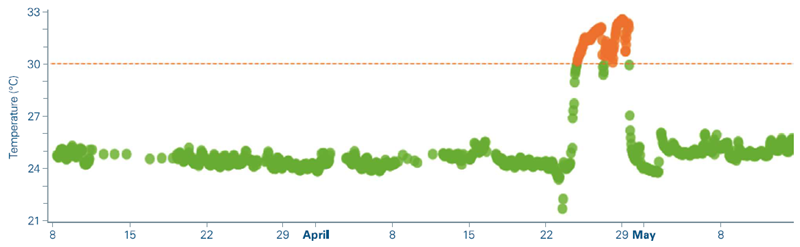
Figure 5. Manual review of instrument readback values in TwinScape shows a significant increase in internal system temperatures. Image Credit: Bruker Daltonics
4. Identification of poor instrument tuning
The QSee test identified a failure in mass calibration in negative ion mode on a timsTOF device (Figure 6). A closer look at the mass spectra revealed poor signal quality, which might be improved by retuning the apparatus. Following the hardware correction, the mass calibration reverted to normal performance, and the spectrum quality was restored.
Impact: Failed QSee™ tests may indicate hardware faults, such as insufficient TIMS or mass calibration, due to missing quality parameters. Identifying these abnormalities early enables targeted corrective action and prevents poor data quality in subsequent analyses.
5. Longitudinal performance monitoring
Over a six-month period, QSee™ was used to track system performance on several LC-TIMS-MS systems. In QSee™ testing, where the LC-MS system passed all criteria, qualifiers like retention times, mass accuracy, and CCS deviations were within tight tolerances.
Both a timsTOF Pro-Elute and a timsMetabo-Agilent setup (positive and negative polarity, with more than 100 injections per configuration and polarity) had standard deviations of ( tR) < 0.002 min, (m/z) < 1.25 ppm, (mSigma) < 25, and (CCS) < 0.3 %. This repeatability demonstrates the workflow's robustness and applicability for large-scale studies.
Impact: Consistent performance across time and locations enables multicenter studies and ensures data comparability in interlaboratory reviews.
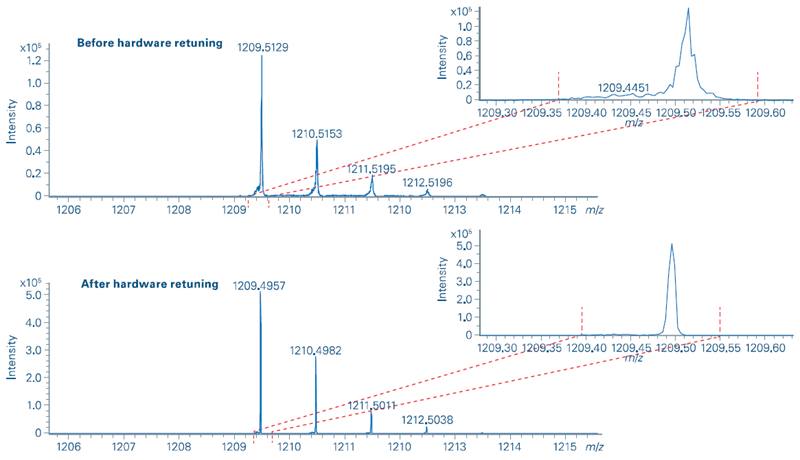
Figure 6. MS signal quality before (top) and after (bottom) hardware retuning of a timSTOF device. Image Credit: Bruker Daltonics
6. User experience and workflow
Users emphasized the ease of incorporation into their usual lab practices. With setup timeframes of less than 30 minutes and automatic reporting, QSee reduces operator burden while increasing system confidence.
When pushing the boundaries of metabolomics and lipidomics-based discovery research, the importance of data quality is paramount.
By integrating QSee Performance Testing into our lab routine, we are conveniently benchmarking our LC-TIMS-MS system performance before each experiment.
The slim and intuitive workflow makes this a straightforward check, and the results provide assurance and peace of mind that we are consistently producing high-quality data. Our confidence in the results has never been higher, thanks to this comprehensive solution. It is truly a game changer for our lab.
Dr. Christoph Trautwein, Director Core Facility Metabolomics, University of Tübingen
These examples indicate that QSee™ is more than just a quality control tool; it also protects scientific integrity. QSee™ enables researchers to focus on discovery rather than troubleshooting by detecting issues early, providing immediate feedback, and enabling long-term surveillance.
Conclusion
- Ensuring the reliability of analytical data is critical in metabolomics, lipidomics, pharmaceutical research, and other applications. As studies expand in size and complexity, having access to transportable system-performance monitoring solutions becomes increasingly crucial. The QSee™ Performance Test meets this demand by providing an elegant and effective solution.
- Its integration with TwinScape™ allows researchers to track instrument health over time and identify faults early. This proactive performance test provides high trust in results - batch after batch, study after study.
- QSee™, which has been verified across many laboratories and platforms, can help with not just routine QC for LC-TIMS-MS experiments, but also longitudinal system surveillance and troubleshooting. In clinical metabolomics, lipidomics, and pharmaceutical research, QSee™ enables researchers to focus on science rather than on system diagnostics.
QSee™ is more than just a performance test. It is a useful tool for guaranteeing constant instrument performance and reliable data quality.
References
- Mosley, J.D., et al. (2024). Establishing a framework for best practices for quality assurance and quality control in untargeted metabolomics. Metabolomics, 20(2). DOI: 10.1007/s11306-023-02080-0. https://link.springer.com/article/10.1007/s11306-023-02080-0.
- Bruker Store. (2026). Qsee™ 8-Mix. (online) Available at: https://store.bruker.com/products/qsee-8-mix.
- Bruker. (2026). TwinScape. (online) Available at: https://www.bruker.com/en/products-and-solutions/mass-spectrometry/ms-solutions/twinscape.html.
- Bruker. (2024). TASQ. (online) Available at: https://www.bruker.com/en/products-and-solutions/mass-spectrometry/ms-software/tasq.html.
- Lippa, K.A., et al. (2022). Reference materials for MS-based untargeted metabolomics and lipidomics: a review by the metabolomics quality assurance and quality control consortium (mQACC). Metabolomics: Official Journal of the Metabolomic Society, (online) 18(4), p.24. DOI: 10.1007/s11306-021-01848-6. https://link.springer.com/article/10.1007/s11306-021-01848-6.
- Li, Y. and Li, L. (2019). Retention time shift analysis and correction in chemical isotope labeling liquid chromatography/mass spectrometry for metabolome analysis. Rapid Communications in Mass Spectrometry, 34(S1). DOI: 10.1002/rcm.8643. https://analyticalsciencejournals.onlinelibrary.wiley.com/doi/10.1002/rcm.8643.
- FutureLearn. The application of quality control samples. (online) Available at: https://www.futurelearn.com/info/courses/metabolomics/0/steps/10703.
- Cambridge Isotope Laboratories. (2026). Metabolomics QC Kits. Available at: https://isotope.com/metabolomics-mixes-and-kits/metabolomics-qc-kit-msk-qc-kit.
About Bruker Daltonics
Empowering Science – Improving Life
Bruker Daltonics delivers cutting-edge mass spectrometry solutions and workflows that help scientists and industry leaders tackle real-world challenges and make new discoveries. From life sciences and pharmaceutical research to food and contaminant analysis, environmental monitoring, forensics, and industrial quality control, our technologies and instruments provide the precision and reliability you need to make confident decisions.
Our innovative platforms - such as timsTOF, scimaX, neofleX, and DART-TQ - combined with advanced software like SCiLS™ Lab, MetaboScape®, and Biopharma Compass®, transform complex data into actionable insights. Breakthrough innovations like Trapped Ion Mobility (TIMS), Omnitrap®, and dual ionization GC-HRMS are redefining what’s possible in mass spectrometry.
Trusted by leading research institutes, universities, government agencies, and industrial partners worldwide, Bruker Daltonics is committed to driving scientific progress and delivering solutions that matter.
(For Research Use Only. Not for use in clinical diagnostic procedures).
Sponsored Content Policy: News-Medical.net publishes articles and related content that may be derived from sources where we have existing commercial relationships, provided such content adds value to the core editorial ethos of News-Medical.net, which is to educate and inform site visitors interested in medical research, science, medical devices, and treatments.