High-sensitivity timsTOF Ultra and analytical-flow LC, combined with VIP-HESI, enable the detection of cell-type-specific metabolites in isolated plant cells.
With high-sensitivity mass spectrometry, single-cell omics research can be advanced. Such instrumentation has sparked interest among scientists across the life science disciplines.
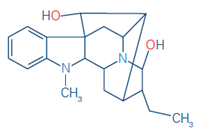
The researchers use the timsTOF Ultra platform and 4D-Metabolomics to examine the presence of cell-type-specific alkaloids in leaf tissue extracts from the medicinal plant Catharanthus roseus.
This article investigates the efficacy of 4D-Metabolomics for detecting unknown chemicals in single-cell samples. The results show that ion mobility separations at the single-cell level combine the benefits of high-resolution mass accuracy, MS/MS capability, and isobaric species.
Mass spectrometry in single-cell research
Mass spectrometry (MS) has emerged as a critical tool for single-cell research, allowing the detection of hundreds of compounds within individual cells.
Several techniques for MS-based, single-cell analysis have been described,1 including imaging platforms such as matrix-assisted laser desorption ionization (MALDI)-MS and direct cell delivery into nanoESI sources using microfluidics-based devices.
This study uses analytical flow LC with the timsTOF Ultra platform to analyze alkaloids in individual plant cells (protoplasts).
Using both targeted and untargeted metabolomics workflows, the researchers show that LC-supported, single-cell mass spectrometry is an effective tool for mapping the distribution of metabolites in different cell types, providing cell-specific information that cannot be obtained from chromatography-free analysis of bulk tissue extracts.
Methods
To enable single-cell sorting, protoplasts (cells without a cell wall) were isolated from C. roseus leaves.2,3 After cell counting and viability testing, the cells were diluted to a concentration of about 104 cells per mL.
Cell suspension (1 mL) was applied to a SIEVEWELL™ chip (Sartorius) and trapped into 50 µm microwells.
The chip was attached to the CellCelector™ Flex (Sartorius) cell-picking device, which features a 50 µm capillary. Individual cells were photographed, chosen, and transplanted to 96-well plates with 5 µL of 0.1 % formic acid aqueous solution.
The destination plates were maintained at 4 °C during cell collection and then frozen at -80 °C for analysis. Cells were lysed by adding 7 µL of methanol with 20 nM ajmaline as an internal standard (IS).
Pooled samples were created by combining 2 µL of each cell extract. Plates were centrifuged at 1000 g for two minutes before being transferred to the autosampler. 4 µL of cell extracts and the pooled sample were placed in the system. Reverse-phase chromatography was used, as stated in Table 1.
Table 1. LC parameters. Source: Bruker Daltonics
| LC |
Agilent 1290 Infinity II |
| Column |
Waters Acquity UPLC BEH
C18 (1.0 x 50 mm, 1.7 μm) |
| Column Oven Temp. |
40 °C |
| Mobile phase |
A: 0.1 % formic acid
B: Acetonitrile |
| 7 min gradient |
Time [min] |
Flow [mL/min] |
%B |
| 0.0 |
0.3 |
1 |
| 5.0 |
0.3 |
70 |
| 5.1 |
0.3 |
99 |
| 5.5 |
0.3 |
99 |
| 5.6 |
0.3 |
1 |
| 7.0 |
0.3 |
1 |
Data was collected using a Bruker timsTOF Ultra trapped-ion mobility quadrupole time-of-flight system with a VIP-HESI source. The MS was set to positive mode for m/z 120-1000.
The trapped ion mobility spectrometry (TIMS) instrument in the timsTOF Ultra can be turned off to collect data in QTOF MS ("3D") mode. 3D data from single cell extracts were collected in the mass range of 120-1000 m/z.
MS/MS data for the pooled samples were collected using a 4D-Metabolomics approach that employed Parallel Accumulation Serial Fragmentation (PASEF®) to separate trapped ions and acquire MS/MS spectra. The mobility range was set at 0.45-1.45 1/K0, and the ramp period was 100 ms.
The data was quantitatively analyzed using Bruker TASQ® 2024b software to assess the presence/absence of 9 essential analytes (Table 2) in the cells and compute their peak intensities.
The MetaboScape® 2024b software was used to perform untargeted metabolomic analysis, with the goal of determining the total number of features (unique m/z and retention time pairings) detectable in the pooled sample, as well as the total number of features with associated MS2 data.
Table 2. Compounds targeted in the single-cell analysis. Source: Bruker Daltonics
| Structure |
Nr. |
Alkaloid |
Formula |
m/z exp. |
m/z meas. |
Δ m/z |
 |
1 |
Ajmaline (IS) |
C20H26N2O2 |
327.2067 |
327.2068 |
0.21 |
 |
2 |
Catharanthine |
C21H24N2O2 |
337.1911 |
337.1914 |
0.92 |
 |
3 |
Tabersonine |
C21H24N2O2 |
337.1911 |
337.1913 |
0.84 |
 |
4 |
Secologanin (Indicator
for epidermal cell) |
C17H24O10 |
389.1442 |
389.1441 |
0.10 |
 |
5 |
Anhydrovinblastine |
C46H56N4O8 |
397.2122 |
397.2125 |
0.91 |
 |
6 |
Vinblastine |
C46H58N4O9 |
406.2175 |
406.2172 |
-0.57 |
 |
7 |
Vindoline (Indicator
fo idioblast cell) |
C25H32N2O6 |
457.2333 |
457.2333 |
0.04 |
 |
8 |
Strictosidine |
C27H34N2O9 |
531.2337 |
351.2337 |
0.07 |
 |
9 |
Serpentine |
C21H20N2O3 |
349.1547 |
349.1548 |
0.31 |
 |
10 |
Loganic acid (indicator for internal phloem-associated
parenchyma cell) |
C16H24O10 |
394.1708 |
394.1709 |
-0.40 |
Results
In this investigation, the researchers examined 168 individual cells for the presence of nine key alkaloids expected in C. roseus cells.
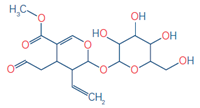
Each alkaloid was effectively identified in subpopulations of individual cells and assigned a cell subtype. Figure 1 shows examples of such cells. Secologanin ([M+H]+ ion at m/z 389.1442, Δ m/z = -0.4 ppm) was discovered in 31 single cells, indicating their identity as epidermal cells.2
These cells also contained strictosidine, a downstream metabolite of secologanin produced by a condensation reaction with tryptamine. In this way, studying metabolite co-occurrence within individual cells can help understand metabolic pathways.
Tabersonine ([M+H]+ ion at m/z 337.1914, ∆ m/z = -0.31 ppm) was found in some cells with catharanthine and vindoline. Tabersonine, the precursor of vindoline, is produced in epidermal cells.2
It is probable that a portion of tabersonine is transported and deposited in idioblast cells, which contain catharanthine, vindoline, and vindorosine, before being directed to vindoline production.
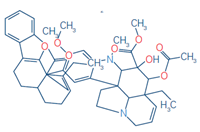
Loganic acid ([M+NH4]+ ion at m/z 394.1709, Δ m/z = -0.4 ppm) was found in extracts of just two cells, indicating they are internal phloem-associated parenchyma cells in C. roseus leaves.2 Vindoline ([M+H]+ ion, m/z 457.2333, Δ m/z =0.1 ppm) was found in five cells.
The presence of vindoline indicates the single cell is an idioblast, as this metabolite is specific to the IB cell subtype.
IB cells are relatively rare and are thought to be the site of aggregation and storage of compounds derived from both primary and specialized metabolism, primarily monoterpene indole alkaloids in C. roseus.
Figure 2 shows extracted ion chromatograms (EICs) for vindoline and five other important alkaloids (catharanthine, serpentine, anhydrovinblastine, strictosidine, and vinblastine) found in a sample of IB cell extract.
This study shows that IB cells can accumulate catharanthine, serpentine, vinblastine (a known anticancer agent), and its precursor, anhydrovinblastine. Characterizing the structures of potential bioactive chemicals is an important approach for drug development.
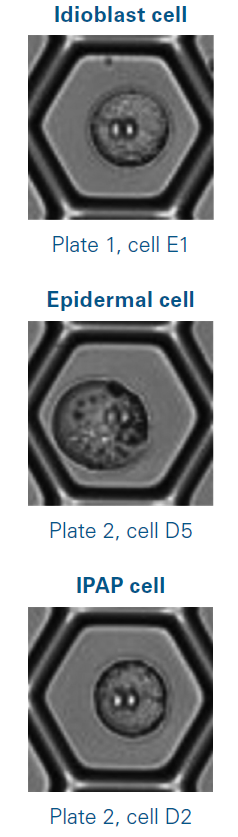
Figure 1. Photos of isolated cells used for the analysis, in which secologanin (epidermal cell) and vindoline (idioblast cell) were detected. E1, D5, and D2 refer to well positions on a multi-well plate. Image Credit: Bruker Daltonics
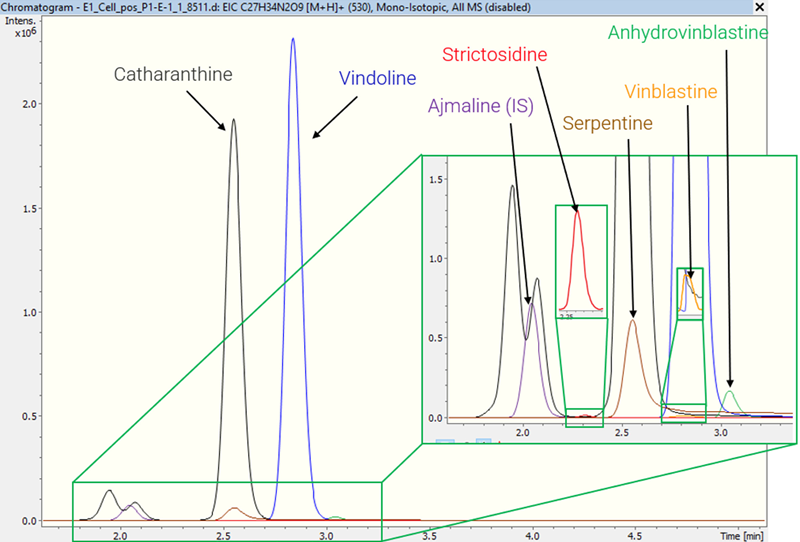
Figure 2. EICs of six alkaloids in an extract of a C. roseus idioblast cell: vindoline, catharanthine, serpentine, anhydrovinblastine, strictosidine, vinblastine and the internal standard ajmaline. Image Credit: Bruker Daltonics
Each of these target alkaloids may be annotated based on exact mass, retention duration, and isotopic pattern information. Loganic acid was identified as an ammonium adduct, anhydrovinblastine and vinblastine as doubly charged ions [M+2H]2+, and the remainder as singly charged protonated species [M+H]+.
TIMS and PASEF® were used in the 4D-Metabolomics approach to more comprehensively annotate the observable metabolome in a pooled sample of single-cell extracts.
The high rate of precursor selection and fragmentation facilitated by the mobility ordering of ion species by TIMS in combination with simultaneous CCS measurement allowed the confident annotation of 133 metabolites using both spectral libraries ("SL", including Bruker HMDB Metabolite Library 2.0, Bruker MetaboBASE Personal Library 3.0, and the NIST 2020 MSMS Spectral Library) and a custom target list ("TL", including retention time and InChI structural data for the key alkaloids). Figure 3 illustrates an SL-derived annotation.
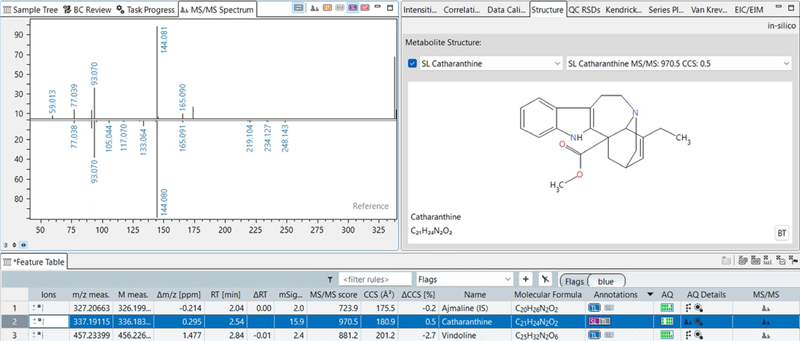
Figure 3. Catharanthine annotation using spectral library information for the comparison of reference (NIST 2020 MS/MS spectral library) and observed (PASEF-based) MS/MS spectra. An MS/MS cosine similarity score of 970 (perfect match = score of 1000) indicates a confident automated annotation, with the butterfly view in MetaboScape providing a graphical representation for ease of review. Image Credit: Bruker Daltonics
Figure 4 shows that, even in the absence of reference MS/MS spectrum data, MS/MS prediction of known structures in a target list serves the same purpose by providing predicted fragment data for high-confidence annotations.
In Figures 3 and 4, a CCS value for the annotated metabolite is calculated with the machine learning model CCS-Predict Pro and used to boost annotation confidence.
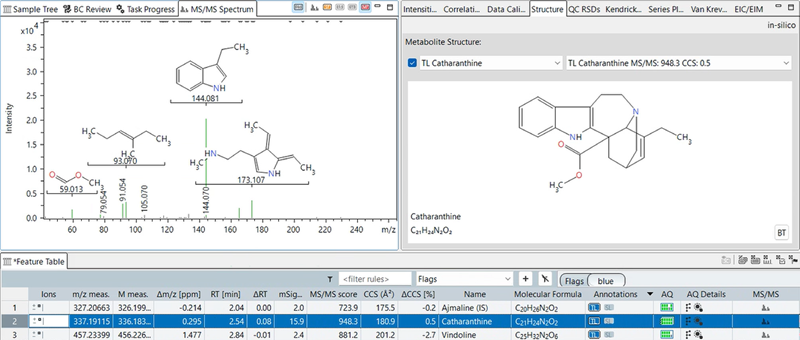
Figure 4. Annotation of a selected alkaloid (catharanthine) in a 4D dataset using target list, CCS-Predict Pro, and in silico fragmentation. The view shows the structure of the metabolites, predicted MS/MS spectrum and fragment structures. Catharanthine´s experimental CCS value matched the predicted CCS value with a 0.5 % deviation. In addition, in silico fragmentation resulted in a high MS/MS matching score of 948. The MS/MS spectrum view in MetaboScape highlights which predicted substructures are matched to which fragment ion. Together, the CCS prediction and in silico fragmentation with the visual inspection of fragment structures, allow for increased confidence in the annotation of this feature as catharanthine. Image Credit: Bruker Daltonics
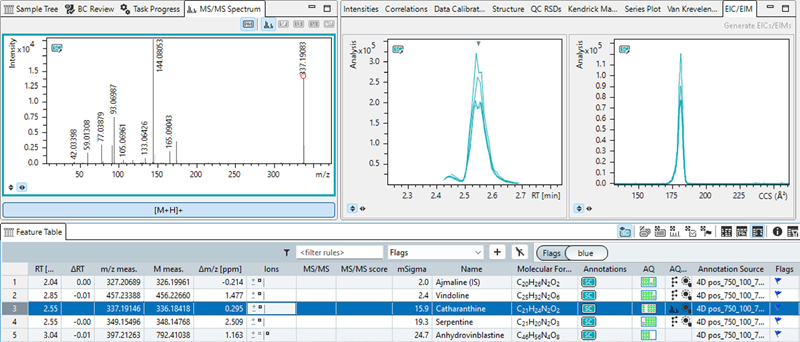
Figure 5. Annotation with sample characterization (SC) table. The EICs, EIMs and MS/MS spectrum of the characterization table (pooled cells 4D analysis) are displayed. Image Credit: Bruker Daltonics
Based on this procedure for automatic annotation and streamlined manual annotation confirmation, data obtained in PASEF mode can be used to create a curated list of annotations for re-evaluating data recorded in 3D MS mode (Figure 5, "Annotate with sample characterization table" option in MetaboScape).
With this method, provisional feature annotations in 3D datasets can be supplemented with data from the 4D analysis of four repeat injections of a pooled sample. Importantly, the technique was effective at resolving co-eluting isobaric species through the mobility dimension.
Figure 6 displays an example of isomer separation using the molecular formula C21H14N2O3.
Based on a MetaboScape library search, this metabolite with the chemical formula C21H14N2O3 was tentatively identified as 1-amino-4-benzamidoanthraquinone. The two mobility peaks could represent structural isomers with differing locations of the amine and/or benzamido functional groups on the anthroquinone backbone.
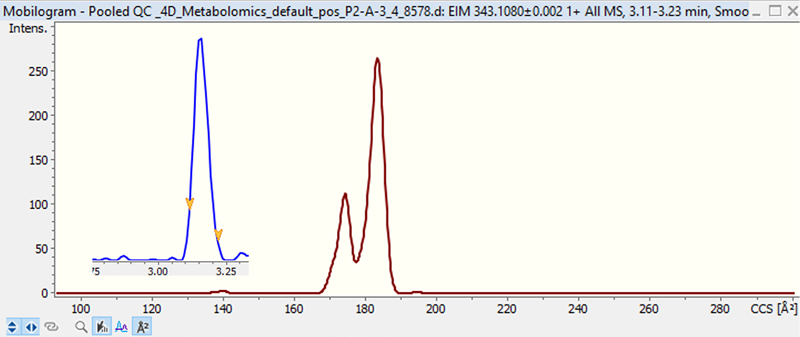
Figure 6. EIC and EIM of metabolite with molecular formula C21H14N2O3 (tentatively 1-Amino-4-benzamidoanthraquinone) highlights the benefits of ion mobility. Image Credit: Bruker Daltonics
Conclusions
- The timsTOF Ultra platform accurately detected alkaloids in individual plant cells. Combining 3D and 4D information from a suitable pooled sample improved annotation confidence.
- The research identified three cell subtypes based on secondary plant metabolites discovered in individual cells in 3D mode.
- Pooled samples evaluated in 4D PASEF mode yielded high-confidence target lists for re-interrogating 3D single-cell data sets.
- The MetaboScape software package includes capabilities for structure elucidation, including in silico fragmentation and CCS prediction, to help identify unknown compounds without legitimate standards.
References
- Xu, S., et al. (2021). Towards high throughput and high information coverage: advanced single-cell mass spectrometric techniques. Analytical and Bioanalytical Chemistry, 414(1), pp.219–233. DOI: 10.1007/s00216-021-03624-w. https://link.springer.com/article/10.1007/s00216-021-03624-w.
- Li, C., et al. (2023). Single-cell multi-omics in the medicinal plant Catharanthus roseus. Nature Chemical Biology, 19(8), pp.1031–1041. DOI: 10.1038/s41589-023-01327-0. https://www.nature.com/articles/s41589-023-01327-0.
- Anh Hai Vu, et al. (2024). Quantitative Single-Cell Mass Spectrometry Provides a Highly Resolved Analysis of Natural Product Biosynthesis Partitioning in Plants. Journal of the American Chemical Society. DOI: 10.1021/jacs.4c06336. https://pubs.acs.org/doi/10.1021/jacs.4c06336.
About Bruker Daltonics
Empowering Science – Improving Life
Bruker Daltonics delivers cutting-edge mass spectrometry solutions and workflows that help scientists and industry leaders tackle real-world challenges and make new discoveries. From life sciences and pharmaceutical research to food and contaminant analysis, environmental monitoring, forensics, and industrial quality control, our technologies and instruments provide the precision and reliability you need to make confident decisions.
Our innovative platforms - such as timsTOF, scimaX, neofleX, and DART-TQ - combined with advanced software like SCiLS™ Lab, MetaboScape®, and Biopharma Compass®, transform complex data into actionable insights. Breakthrough innovations like Trapped Ion Mobility (TIMS), Omnitrap®, and dual ionization GC-HRMS are redefining what’s possible in mass spectrometry.
Trusted by leading research institutes, universities, government agencies, and industrial partners worldwide, Bruker Daltonics is committed to driving scientific progress and delivering solutions that matter.
(For Research Use Only. Not for use in clinical diagnostic procedures).
Sponsored Content Policy: News-Medical.net publishes articles and related content that may be derived from sources where we have existing commercial relationships, provided such content adds value to the core editorial ethos of News-Medical.net, which is to educate and inform site visitors interested in medical research, science, medical devices, and treatments.