New developments in organoid technology have opened up new possibilities for translational human disease research, regenerative medicine, disease modeling, and predictive precision therapies.1
Organoids are differentiated primary microtissues produced from a range of stem cells (SCs). Organoids can be established within 3D extracellular matrices to mimic genetic diversity and in-vivo architecture.1
Because they are self-renewing and self-organizing structures, organoids have a clear advantage over traditional monolayer culture techniques, possessing unparalleled potential for a wide range of applications.1,2 In order to successfully make use of these models in fundamental research, drug screening and disease modeling, reliable, specific in-vitro culture and analysis methods are necessary.
The characterization and subsequent optimization of organoid cultures is currently limited in terms of its capacity to objectively monitor these 3D structures over time as they form and grow. The Incucyte® Organoid Analysis Software Module offers a means of standardizing and automating organoid culture workflows while streamlining the characterization and optimization of cultures.
Assay principle
This article explores applications of the Incucyte® Live-Cell Analysis System and Incucyte® Organoid Analysis Software Module in a study of organoid culture formation. A proprietary approach to Brightfield (BF) image acquisition facilitates real-time kinetic imaging of 3D organoids that have been embedded within Matrigel® domes.
Organoid count, size, and morphology measurements are automatically plotted over time, providing robust insight into organoid maturation and differentiation characteristics.
This article outlines validation methods and data, which establishes a means of kinetically visualizing and quantifying organoid formation and growth in Matrigel® domes.
Material & methods
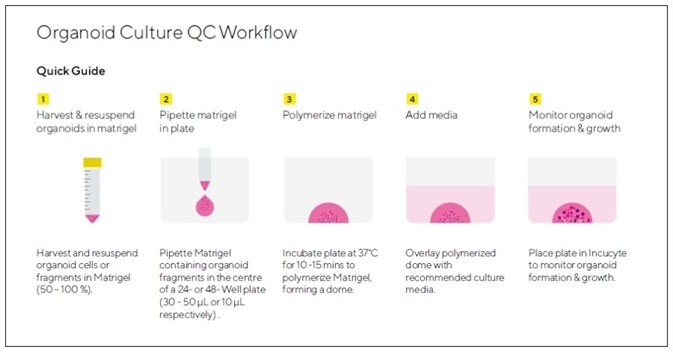
Figure 1. Assay Workflow.
1. Organoids of interest are harvested according to model-specific guidelines and organoid pellet is re-suspended in Matrigel® (50 – 100%).
2. Matrigel® containing single cells or organoid fragments is pipetted into the center of a well in a 24-well or 48-well tissue culture treated plate to form a dome (10 μL in 48-well plate, 30 μL- 50 μL in 24-well plate).
3. Plate is placed in a humidified incubator to polymerize Matrigel® (37 °C, 10 – 15 minutes).
4. Cell type-specific growth media is added on top of solidified dome (250 μL/well in 48-well plate or 750 μL/well in 24-well plate).
5. Organoid formation and growth is monitored in an Incucyte® (Organoid scan type, 4X, 6 hour repeat scanning, 5 – 10 days). Organoid size ( maturation) is reported in real-time based on brightfield image analysis.
Image Credit: Sartorius
In the examples presented here, organoid culture reagents were acquired from StemCell Technologies unless otherwise stated.
Pancreatic (#70933), Mouse Intestinal (#70931), and Hepatic (#70932) organoids were embedded in Matrigel® domes (Corning #356231) in 24-well or 48-well flat bottom TC-treated microplates (Corning #3526, 3548 respectively).
They were cultured in organoid growth medium (IntestiCult™ OGM Cat. #06005; PancreaCult™ OGM #06040; HepatiCult™ OGM #06030) and supplemented with 100 units/100 μg per mL Pen/Strep (Life Technologies).
An Incucyte® was used to monitor organoid formation and growth for up to 10 days, measuring these at 6 hour intervals.
Monitoring and quantifying organoid growth in Matrigel® domes
Mouse pancreatic, intestinal, and hepatic organoids were embedded within Matrigel® domes (50% or 100%) in 24-well plates before being imaged every 6 hours.
Incucyte’s automated Organoid Software Analysis Module was employed to measure organoid growth, maturation and differentiation - effectively tracking changes in size (area) of organoids over time.
Figure 2 shows the software’s capacity to visualize a sole in-focus 2D image, displaying individual organoids embedded all over the Matrigel® dome (top). Using time-courses and close up BF images (bottom) allowed the software to reveal growth profiles and cell type-specific morphological features, respectively.
It should be noted that equivalent size (BF images) and rapid growth (time-courses) of mature hepatic and pancreatic organoids are different to intestinal organoids, appearing smaller while exhibiting a distinctive budding phenotype as they mature.
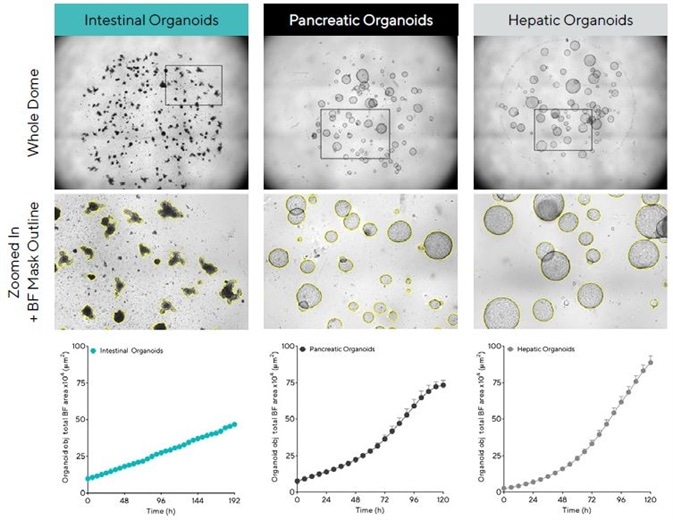
Figure 2. Acquisition and quantification of organoid growth in Matrigel® domes. Mouse intestinal (1:3 split, 50% Matrigel), pancreatic (1:5 split, 100% Matrigel®) and hepatic organoids (1:40 split, 100% Matrigel®) were embedded in Matrigel® domes in 24-well plates and imaged every 6 h in an Incucyte. Brightfield (BF) images of the entire Matrigel® dome (top) show organoid maturation 6 days post seeding. Note accurate segmentation (yellow outline mask) and distinct phenotypes of mature organoids (bottom). Time-course plots showing the individual well total BF area (μm2) over time (h) demonstrate cell type specific organoid growth. All images captured at 4X magnification. Each data point represents mean ± SEM, n = 4 wells. Image Credit: Sartorius
Optimization and characterization of organoid cultures using real-time kinetic measurements
The robust definition of optimal culture regimes and conditions is essential in the establishment of healthy cultures intended for use in downstream studies. Objectively defining key parameters, including passage frequency and seeding densities, is central to this process while simultaneously ensuring that cultures have differentiated and exhibit proper morphology.
Measuring proliferation to optimize growth conditions and seeding densities
In order to optimize organoid seeding density, mouse hepatic organoids were embedded in Matrigel® domes (100%) in 48-well plates at various split ratios (1:10 – 1:40 split).
Both BF images and full quantification of the organoid area confirmed that organoid size and growth rate is proportional to the amount of cells seeded (Figure 3). Organoids that were seeded at the highest density were generally larger (>500 μm diameter), exhibiting rapid growth and reaching maximum size (73.4 × 104 µm2 ± 2.3 mean ± SEM, n = 14 wells) within 120 hours. Figure 3 shows the BF images and total area time-course.
The organoid maturation phase was extended at lower densities (28.6 × 104 µm2 ± 2.9 mean ± SEM, n = 14 wells at 120 hours, total area), and the greatest growth potential (size) was observed here. Figure 3 shows the average area time-course.
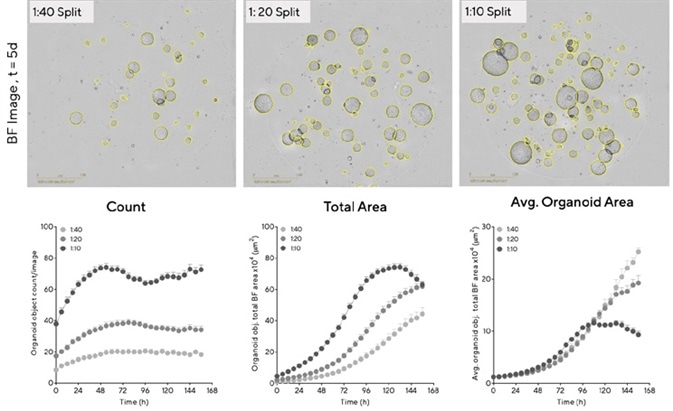
Figure 3. Determine optimal conditions for maximal organoid expansion. Mouse hepatic organoids were embedded in Matrigel® domes (100%) in 48-well plates at multiple seeding densities. BF Images (5 d post seeding) and time-courses of individual well area and count demonstrate density-dependent organoid growth. Data were collected over 168 h at 6 h intervals. All images captured at 4X magnification. Each data point represents mean ± SEM, n=14 wells. Image Credit: Sartorius
Measuring morphological features to define optimal organoid maturation phase
Mouse hepatic organoids were embedded in Matrigel® domes (100%) before being imaged in an Incucyte® for 8 days. This was done in order to define optimum organoid passaging frequency.
Hepatic organoids are generally suitable for passaging when most of the organoids have reached their maximum growth while not collapsing.3 Representative BF images in Figure 4 show that cultures are not yet suitable for passaging two days post seeding because most of the organoids are under 100 μm in diameter while exhibiting clear lumens.
A reduction in eccentricity was also noted within 48 hours as organoids were observed, forming and becoming more rounded (Figure 4, time-course). The most ideal window for passaging this culture existed between days 4 and 5, when the majority of the organoids within the dome had reached maximum size, exhibiting a rounded morphology with no signs of collapse (Figure 4).
The time-course displays a notable rise in organoid darkness as collapsed organoids were found to darken over time (Figure 4, time-course, >96 hours).
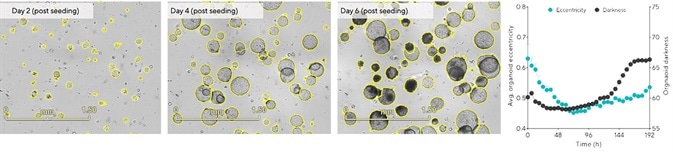
Figure 4. Define cell-type specific passage frequency using integrated morphology metrics. Hepatic organoids were embedded in 100% Matrigel® domes (1:10 split) in 24-well plates. Tracking changes in organoid eccentricity (object roundness) and darkness (object brightness) enabled rapid assessment of optimal culture passage periods. Images (day 6) and time-course data demonstrate that organoids that reached maximal size collapsed (increased eccentricity) and darkened (increased darkness). Data were collected over 192 h at 6 h intervals. All images captured at 4x magnification. Each data point represents mean ± SEM, n=6 wells. Image Credit: Sartorius
Tracking organoid differentiation and growth efficiency through passages
Under standard culture conditions, it is anticipated that organoid morphology and growth capabilities would remain consistent across a range of passages.
Evaluating intestinal organoid expansion and growth efficiency across passages required the kinetic quantification of a number of parameters (Figure 5). Intestinal organoids were found to exhibit comparable area, count, eccentricity and darkness measurements across passages (Figure 5) when these were maintained at a consistent density.
Representative BF images taken acquired after 7 days can also be seen to demonstrate maintenance of distinctive budding phenotype across a range of passages. Figure 5 epitomizes the potential of this approach to imaging and analysis in supporting reproducible, robust assessment of long-term organoid expansion.
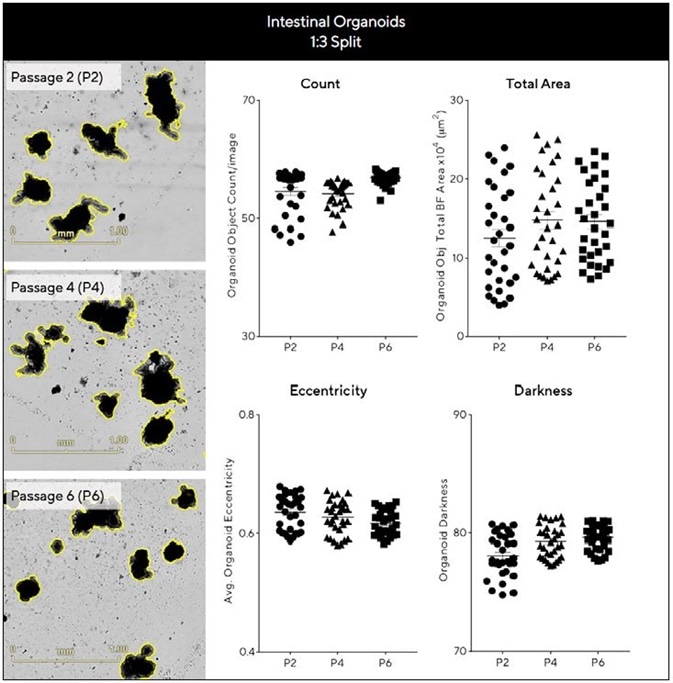
Figure 5. Assess growth and differentiation efficiency of organoids across multiple passages. Intestinal organoids were embedded in 50% Matrigel® domes (1:3 split, 24-well plate) over multiple passages and Evaluated for growth and differentiation consistency over time. BF images (7 days post seeding) and corresponding plots show comparable morphology and growth across passages. Data were collected over 192 h at 6 h intervals. All images captured at 4X magnification. Each data point represents mean ± SEM, n=6 wells. Image Credit: Sartorius
Conclusions
In summary, this article explored the use of the Incucyte® Live-Cell Analysis system, in conjunction with the Incucyte® Organoid Analysis Software Module in the kinetic assessment of organoid formation and growth.
The examples presented above clearly illustrate the capacity of this approach to automatically locate and analyze 3D organoids that have been embedded within Matrigel® domes in both 24- and 48-well plates.
Utilizing integrated, real-time label-free metrics in the optimization and definition of culture conditions and regimes is also made possible using this approach, and it is possible to ascertain optimal periods for passaging or extension of organoid cultures based on integrated morphological parameters.
Overall, use of this approach is highly suitable for assessing culture quality during extended passaging.
References
- D. e. al., “Disease modeling in stem cell-derived 3D organoid systems,” Cell Press, vol. 23, no. 5, pp. 393-410, 2017.
- G. e. al., “Long-term expansion, genomic stability and in vivo safety of adult human pancreas organoids.,” BMC Dev Biol, vol. 4, 2020.
- “StemCell Technologies,” [Online]. Available: https://www.stemcell.com/.
About Sartorius

Sartorius is a leading international pharmaceutical and laboratory equipment supplier. With our innovative products and services, we are helping our customers across the entire globe to implement their complex and quality-critical biomanufacturing and laboratory processes reliably and economically.
The Group companies are united under the roof of Sartorius AG, which is listed on the Frankfurt Stock Exchange and holds the majority stake in Sartorius Stedim Biotech S.A. Quoted on the Paris Stock Exchange, this subgroup is comprised mainly of the Bioprocess Solutions Division.
Innovative technologies enable medical progress
A growing number of medications are biopharmaceuticals. These are produced using living cells in complex, lengthy and expensive procedures. The Bioprocess Solutions Division provides the essential products and technologies to accomplish this.
In fact, Sartorius has been pioneering and setting the standards for single-use products that are currently used throughout all biopharmaceutical manufacturing processes.
Making lab life easier
Lab work is complex and demanding: Despite repetitive analytical routines, lab staff must perform each step in a highly concentrated and careful way for accurate results.
The Lab Products and Services Division helps lab personnel excel because its products, such as laboratory balances, pipettes and lab consumables, minimize human error, simplify workflows and reduce physical workloads
Sponsored Content Policy: News-Medical.net publishes articles and related content that may be derived from sources where we have existing commercial relationships, provided such content adds value to the core editorial ethos of News-Medical.Net which is to educate and inform site visitors interested in medical research, science, medical devices and treatments.