The potential to monitor, study, and assess the activity of neuronal cells accurately representing human phenotypes is a major barrier in the study of human diseases that affect the nervous system. The use of neurons derived from human-induced pluripotent stem cells (hiPSC) is a novel method for monitoring neurological disorders.
Shortcomings of existing biological protocols and instrumentation clearly show that there is a need for more advanced methods developed to quantify the functional activity and connectivity of iPSC-derived neurons over time with very little perturbation.
This article presents validation data obtained using the Incucyte S3® live-cell analysis system to define spontaneous neuronal activity and connectivity from a range of hiPSC-derived neurons and rat primary neurons after the transduction of a genetically encoded calcium indicator (GECI).
Different metrics of neuronal activity—such as active object #, strength, mean intensity, duration, and rate, as well as network correlation (connectivity) over days/weeks in culture—were analyzed by using the Incucyte S3® automated live-cell neuronal activity analysis software.
Neuronal activity workflow
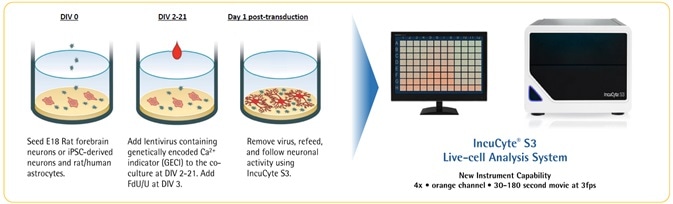
Image Credit: Incucyte®.
Automated neuronal activity analysis and metrics
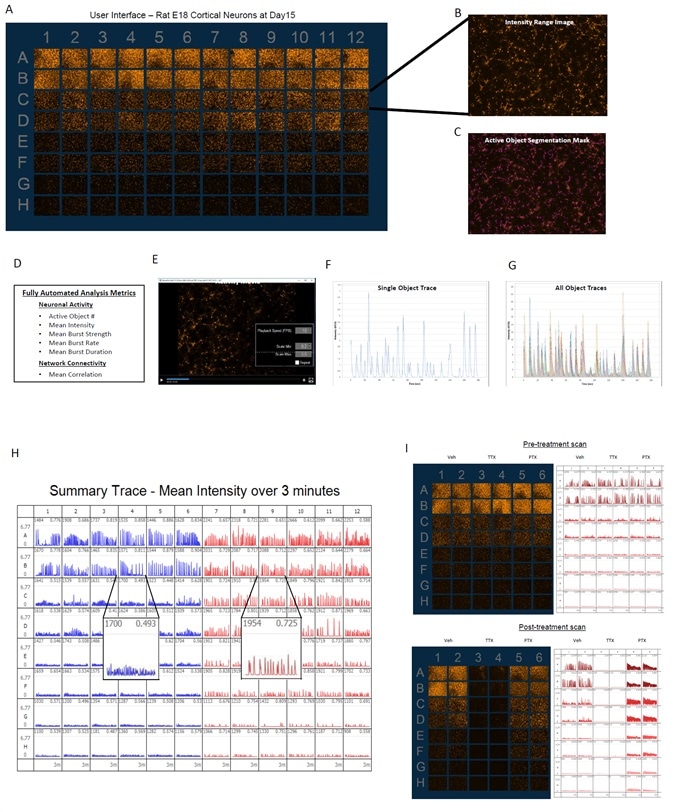
Image Credit: Incucyte®.
- The images above illustrate the user interface designed to observe data from a 96-well plate at each scan of the experiment (A).
- Fluorescent image depicts the activity range over a complete 30–180 second scan (B).
- Active objects are defined by automated segmentation (C).
- Integrated analytical tools enable data analysis of neuronal activity with metrics that outline the neuronal activity (active object #, mean intensity, burst rate, burst duration, burst strength) and connectivity (mean correlation) (D).
- It is feasible to generate movies for each well using viewing and export tools (E) and single object temporal traces (F) or overlays of temporal traces of all active objects in an image (G) can be displayed.
- Summary traces of mean intensity of the whole well offer comprehensive plate view of data along with mean correlation metrics and active object # for well-to-well comparison (H).
- Sample data with endpoint pharmacology of picrotoxin (PTX, 100 μM) or tetrodotoxin (TTX, 1 μM) exhibits the qualitative effects on neuronal activity, where PTX treatment increases the burst rate and correlation (connectivity) and TTX treatment considerably decreases all quantified metrics. This shows that the activity measured is synaptically induced (I).
iCell GlutaNeuron spontaneous activity kinetic analysis
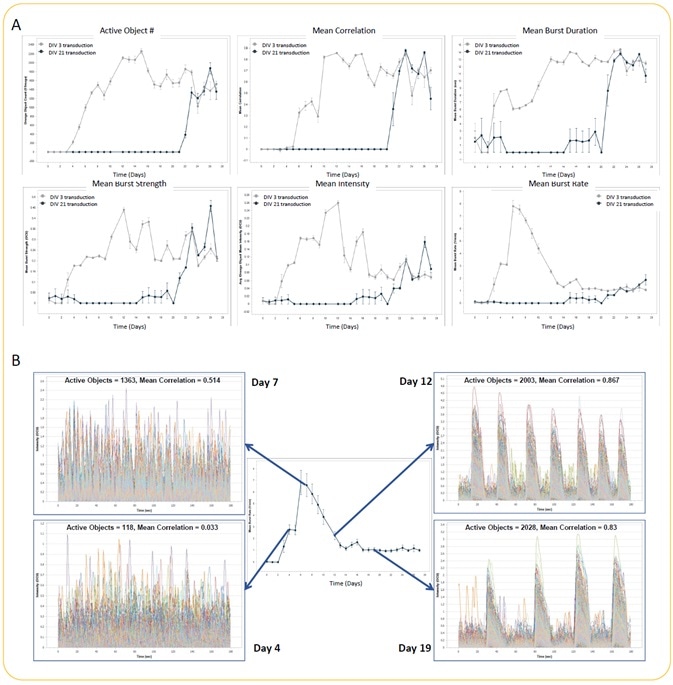
Image Credit: Incucyte®.
- Seeding of iCell GlutaNeurons from Cellular Dynamics International was performed at the rate of 30K cells/well, together with a co-culture of rat astrocytes seeded at 15K cells/well on PEI/laminin-coated 96-well culture plates.
- GECI reagent was used to transduce neurons at DIV 3 or DIV 21. Monitoring and analysis of spontaneous neuronal activity were performed for 27 days starting at DIV 3.
- Quantification of active object #, mean intensity, mean correlation, mean burst rate, mean burst duration, and mean burst strength (A) (n = 3 wells for each condition) was analyzed in an automated manner. There were no differences in metrics between DIV 3 and DIV 21 GECI transduction at later time points.
- The variation in the neuronal activity pattern while performing the experiment with DIV 3 GECI transduction is illustrated by example trace overlays of all active objects from a single well at Days 4, 7, 12, and 19 (B). Mean burst rate kinetic graph has been included to underscore the differences in activity (trace) over time.
Peri.4U morphology + spontaneous activity analysis
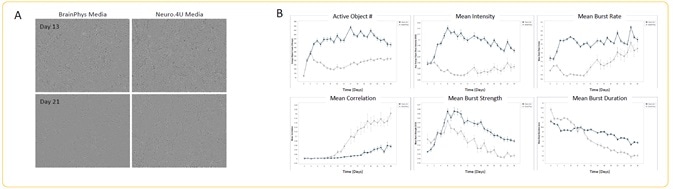
Image Credit: Incucyte®.
- Seeding of Peri.4U Neurons from Ncardia was performed at the rate of 25K cells/well, together with a co-culture of rat astrocytes seeded at 15K cells/well on PEI/laminin coating.
- Transduction of neurons was done with GECI reagent at DIV 2, which were then cultured in Neuro.4U media or BrainPhys media.
- Differences in media had no effect on the morphology of the neurons on Day 13 or Day 21 of scanning (A).
- Quantification of the metrics of spontaneous activity was performed starting at DIV 3 (n = 3 wells).
- There was an increase in all analyzed metrics in Neuro.4U media, except mean correlation, which clearly shows the impact of culture media on neuronal activity (B).
Modulation of iNeuron spontaneous activity via FGF2 treatment
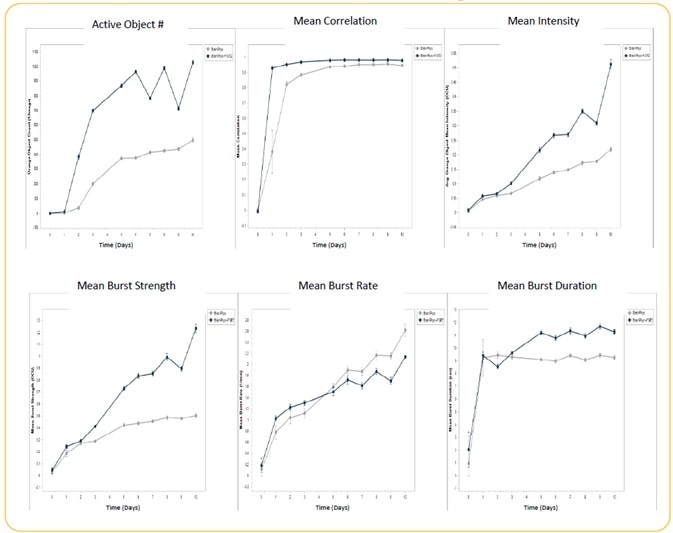
Image Credit: Incucyte®.
- Induced iPSC-derived neurons, or iNeurons, obtained from Michael Uhler’s lab at the University of Michigan were seeded at the rate of 10K cells/well, together with a co-culture of rat astrocytes seeded at 15K cells/well on Matrigel.
- Culturing of cells were performed +/− FGF2 (20 ng/ml). Transduction of iNeurons was performed with GECI reagent at DIV 21, and spontaneous neuronal activity was quantified for 10 days following GECI transduction through automated analysis (n = 3 wells).
- Treatment with FGF2 increased active object #, mean intensity, mean burst duration, and mean burst strength. There was no effect of FGF2 on mean correlation, although there was a decrease in mean burst rate.
Conclusions
- Both rat primary neurons and multiple human iPSC-derived neuronal models were used for validating the Incucyte S3® spontaneous neuronal activity and analysis system (refer to the summary table below).
- Spontaneous neuronal activity can be modified over time by both the addition of growth factor and culture conditions (for example, media/coating substrate).
- These data show the advantage of using the Incucyte S3® spontaneous neuronal activity and analysis system as an effective tool to image, monitor, and analyze live-cell neuronal activity over time from hundreds to thousands of cells cultured in 96-well microplates with very less perturbation.
Source: Incucyte®
| Cells |
Type |
Setup |
Vendor |
Differentiation |
Media
Pref |
| Rat E18 Forebrain |
Primary |
Co-culture |
Thermo/
Global Stem |
NA |
BrainPhys or NB |
| iCell GlutaNeurons |
iPSC |
Mono and Co |
CDI |
Unknown |
BrainPhys |
| iCell GABANeurons |
iPSC |
Mono and Co |
CDI |
Unknown |
BrainPhys |
| iCell DopaNeurons |
iPSC |
Co-culture |
CDI |
Unknown |
BrainPhys |
| MyCell DopaNeurons (A53T) |
iPSC |
Co-culture |
CDI |
Unknown |
BrainPhys |
| Peri.4U |
iPSC |
Co-culture |
Ncardia |
Unknown |
Ncardia |
| CNS.4U |
iPSC |
Co-culture |
Ncardia |
Unknown |
Ncardia |
| iNeurons |
iPSC |
Co-culture |
Academic |
Neurogenin2 |
BrainPhys |
Acknowledgments
Produced from materials originally authored by Aaron C. Overland1, John N. Rauch1, Libuse Oupicka1, Michael D. Uhler2, David M. Rock1, Daniel M. Appledorn1 from 1. Essen BioScience (A Sartorius Company) 2. University of Michigan
About Incucyte®
The Incucyte® Real-Time Quantitative Live Cell Analysis System, designed by Essen BioScience, Inc (now a Sartorius company) is the first system to continuously quantify cell behavior over time (from hours to weeks) while cells remain undisturbed inside a standard incubator. The Incucyte® System automatically collects and analyzes images continuously around the clock, providing insight into active biological processes that is difficult to achieve with endpoint assays. The Incucyte® suite of assays utilize proprietary reagents that do not perturb cell health with validated 96/384 well format protocols that save time and money.
Incucyte® Live-Cell Analysis has revolutionized numerous studies, with applications such as stem cell monitoring and reprogramming, label-free analysis, ATP metabolism, multiplexing, neurite outgrowth and dynamics, migration/invasion, 3D-spheroids, angiogenesis, NETosis, reporter gene expression, immunocytochemistry, immune cell killing, apoptosis, cytotoxicity, kinetic data generation, antibody internalization. All this without the removal of cells from an incubator.
Sponsored Content Policy: News-Medical.net publishes articles and related content that may be derived from sources where we have existing commercial relationships, provided such content adds value to the core editorial ethos of News-Medical.Net which is to educate and inform site visitors interested in medical research, science, medical devices and treatments.