Introduction
Cell proliferation assays are essential in developmental biology, drug safety research, and cancer therapeutic. More than 10.000 manuscripts in PubMed talk about the sustained signaling pathways that cause the progression of tumors.
Most of these manuscripts have measurements on cell proliferation. In spite of this, there has been no, straightforward, direct, industrialized technique to quantify the cell proliferation as a continuous process and those available are mere end-points to measure the time-course.
Most of the biochemical detection methods such as ATP or LDH detection are indirect and involve the use of tools that cannot be easily validated by morphological changes. This drawback can be overcome by chemical and antibody probe-based high content imaging techniques, but these are not suitable for temporal assays over the long term.
Non-invasive fully kinetic measures of cell proliferation using IncuCyte® live cell imaging is a valid and invaluable method that is based on area (confluence) metrics, and can be used in various applications (Figure 1).
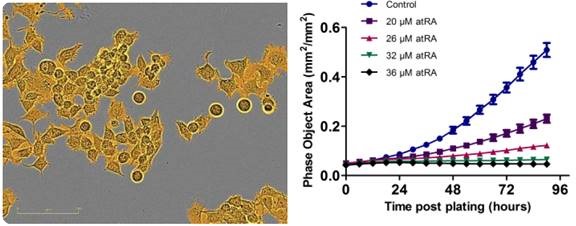
Figure 1. Proliferation is successfully measured using an IncuCyte® phase-only processing module. An IncuCyte® mask (goldenrod) analyzes a phase-contrast image of proliferating neuro-2a cells. The proliferation of neuro-2a cells decreases under increasing concentrations of all-trans retinoic acid.
Conversely, quantification of low contrast cells can be very complicated and morphological changes in the cell, such as expansion or shrinkage, and obtaining full confluence can result in cell numbers becoming non-linear.
Moreover, analysis of multiple cell types in co-culture cannot be conducted through confluence measurement alone.
A new method that can quantify kinetic cell proliferation by directly counting nuclear cells by employing new nuclear-restricted red or green fluorescent proteins (known as NucLight Red and NucLight Green (Figure 2)) and the IncuCyte® platform has been used to counteract the above-mentioned issues. This method offers a content-rich, fully kinetic, medium-throughput solution.
This article will show the flexibility and validity of the NucLight reagents in tandem with the IncuCyte® platform, while exploring the cancer cell proliferation in co-culture with fibroblasts. In addition, it also demonstrates the applicability of the IncuCyte® platform in the screening of cellular proliferation.
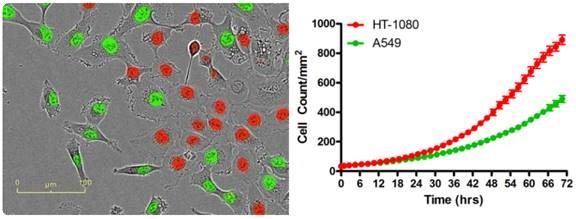
Figure 2. A wide range of co-culture-based assays are possible by fluorescently labeling the nuclei of one or more cell types (HT-1080 red; A549 green) with a non-perturbing nuclear-targeted fluorescent protein. IncuCyte® fluorescent object counting software successfully quantifies real-cell proliferation.
Approach and methods
Cancer cell co-culture: growth conditions and experimental set-up
HMF, CCD-1068Sk, and SK-BR-3 cells were cultivated in Dulbecco’s Modified Eagle’s Medium (DMEM) with 2% Glutamax, 1xPenStrep-Glutamine, and 10% FBS. NucLight Red was used to infect SK-BR-3 cells at an MOI of 3 transducing units/mL with 8μg/mL Polybrene®.
In order to choose for SK-BR-3 cells that exhibit NucLight Red, a complete media with 1μg/mL puromycin was added to the cells, a couple of days after infection.
Cells were retained in complete media containing 0.5μg/mL puromycin, and co-culture tests were conducted in complete media without puromycin.
HMF cells or CCD-1068Sk cells were seeded at a 9,000 cells/well density into 32 wells each in a 96-well plate. The cells were subjected to overnight incubation at 5% CO2 and at a temperature of 37°C. 9,000 cells/well of SK-BR-3 cells that expressed NucLight Red were removed from the incubation the next day.
These cells were seeded in all 96 wells causing one monoculture and two co-cultures. Lapatinib, which was serially diluted 3-fold in 100% DMSO, was added in medium to the cells at a final concentration range of 6.86nM to 5000nM ~6 hours later.
There was a consistent 0.5% DMSO concentration in all wells. The cells were imaged for 8 days using IncuCyte®. 67% of the media was modified on DIV 4.
Cancer cell co-culture: IncuCyte™ data quantification and analysis
Red fluorescent and phase-contrast images were obtained on IncuCyte®. Red nuclear objects were counted using a particular processing definition during the assay period. These nuclear objects were exported into GraphPad Prism Software per mm2 from all the wells at all the time points.
After calculating the area under the curve (AUC) for all the concentrations (n=4), it was used to determine IC50 values for SK-BR-3 grown with HMF, SK-BR-3 grown with CCD-1068Sk, and lapatinib for SK-BR-3 grown in monoculture.
Screening assay
Sartorius' CellPlayer™ NucLight Green reagent was used at an MOI of 3TU/mL with 8μg/mL polybrene to transduce the parent cell lines and create stable populations of NucLight Green HT-1080 cells.
Populations that expressed green fluorescent protein limited to the nucleus were chosen for a complete medium that contained 1μg/mL puromycin for 3-5 days. These were then retained in complete medium with 0.5μg/mL puromycin.
By employing a Multidrop automated cell dispenser, HT-1080 cells were plated for 6-12 hours in full media/serum at 2000 cells/well. Compound plates that consist of 16 different compounds with 11 different concentrations each were made in 100% DMSO.
A 384-well PlateMate Plus liquid handler was used to make low volume (1μL) plate copies. These were then diluted to 100μL in media/serum. An aspirator manifold was used to remove the media from the cell plate.
50μL of the compound with fresh media was used to replace the previous one. Cell plates were once again placed in the IncuCyte® and scans were performed at regular intervals of 3 hours for 72 hours.
Screening experiment: IncuCyte™ FLR data quantification and analysis
In order to detect increase in cell count, fluorescent and phase-contrast images were obtained through NucLight Green nuclear object counting.
The fluorescent nuclear signal was separated from the background using the algorithm and the nuclei were recorded on a per-area (mm2) basis for every time point. The temporal object count data was exported into MS Excel to analyze all the cell proliferation time-course for peak cell number.
In order to obtain IC50 values, concentration-response curves were constructed to inhibit proliferation and with an XLfit, matched to a four parameter logistic equation. Time-lapse videos and representative images of the cells were used to verify the quantification.
Results and discussion
Quantitative measurement of cancer cell proliferation using nuclight red reagent in a co-culture model
Some cancers can resist chemotherapy within the context of the tumor microenvironment, or because of their neighboring cells’ biological activity. Cell interactions that rescue tumors from chemotherapy drugs can be highlighted by contrasting co-cultures and monocultures using in vitro assays.
This research examined the culture-dependence of a breast adenocarcinoma cell line, known as SK-BR-3, which overexpresses HER-2. The sensitivity of monocultures of SK-BR-3 cells to the lapatinib drug was demonstrated in earlier research.
The drug causes cell death as it inhibits the tyrosine kinase activity of EGFR and HER-2 pathways2. Conversely, another research demonstrated that stromal cells were capable of saving the effect of lapatinib when SK-BR-3 cells were co-cultured with normal skin fibroblasts.
When SK-BR-3 cells cultivated in co-culture with normal human mammary fibroblasts (HMF), there was no rescue effect1. In another research, the proliferation of SK-BR-3 cells in co-culture and monoculture was kinetically and constantly observed with increasing concentrations of lapatinib, using CellPlayer NucLight Red reagents and IncuCyte® in tandem.
IncuCyte’s® nucleus counting algorithm was used to quantify the SK-BR-3 cells. By employing this method, real-time counting can be performed based on nuclear restricted fluorescent protein expression.
Kinetic graphs of nuclear counts per mm2 over time show that the growth of SK-BR-3 cells, grown with CCD-1068Sk fibroblasts, take place at a much higher rate than those cultivated with HMF’s in the presence of ≈500 nM lapatinib or those cultivated alone (Figure 3).
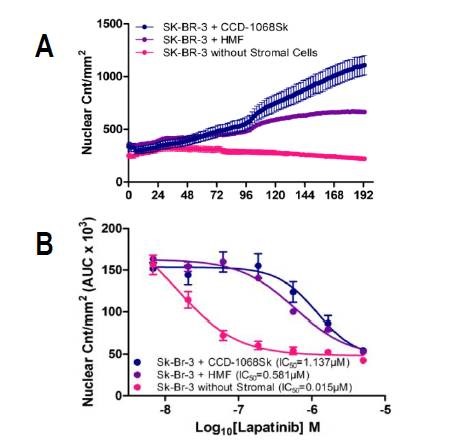
Figure 3. Proliferation of SK-BR-3 cells in co-culture and monoculture under lapatinib treatment. SK-BR-3 cells expressing a nuclear restricted red protein were grown with normal skin fibroblasts (CCD-1068Sk), human mammary fibroblasts (HMF), or in monoculture, and treated with varying concentrations of lapatinib for 8 days. (A) Nuclear counts per mm2 of SK-BR-3 cells grown with or without stromal cells in the presence of 556 nM lapatinib illustrate the rescue effect of CCD-1068Sk fibroblasts compared to HMFs and mono-culture. (B) Area under the curve of nuclear counts per mm2 over time for each concentration (n=4) was used to calculate and compare IC50 values of SK-BR-3 cells grown with or without stromal cells.
IC50 values also provide concrete quantitative proof about the variations in drug response between co-cultures and monoculture in the presence of lapatinib. In particular, SK-BR-3 cells cultivated with CCD-1068Sk fibroblasts were found to be the least sensitive to lapatinib with an IC50 value of 1.162μM, while SK-BR-3 cells cultivated with HMF had an IC50 value of 0.581μM (Figure 3B).
SK-BR-3 cells cultivated in mono-culture continued to remain sensitive to lapatinib with an IC50 value of 0.015μM (Figure 3B), which corresponds to the published IC50 value of 0.037±0.031μM.
Two separate experiments were performed in which these data were repeated. The prominent data clearly show the variation in the cell proliferation of SK-BR-3 cells in the presence of stromal cells, thereby emphasizing the significance of the effect tumor microenvironment has on drug resistance.
High-throughput compound testing using nuclight green labeled HT-1080s
Promising drugs can be efficiently siphoned through the drug discovery pipeline using high-throughput compound testing. In this regard, the IncuCyte® system can be used to address this requirement.
Therefore, to assess the system’s ability, cell proliferation was quantified over time in a higher-throughput format. Also, HT-1080 tumor-derived fibrosarcoma was applied with 16 literature-standard compounds (Table 1) in a 384-well format (Figure 4) to evaluate various pharmacological agents at the same time.
For each compound, an 11-point concentration response curve was developed (Figure 5). Among the 16 compounds tested, the rank order of potency to inhibit cell proliferation was: doxorubicin = staurosporine = camptothecin > mitomycin C > cycloheximide = RITA > PD-98059 > FAK inhibitor 14 = cisplatin > 10-DEBC = Chrysin = Compound 401.
Table 1. Drugs identified in literature as relevant to cell proliferation
|
Drug
|
Description
|
|
Doxorubicin
|
Chemotherapy drug, intercalates DNA
|
|
Camptothesin
|
Alkaloid inhibits topoisomerase, causing DNA damage
|
|
MitomycinC
|
chemotherapy drug, alkylates DNA5
|
|
Cycloheximide
|
protein synthesis inhibitor
|
|
RITA
|
(reactivation of p53 and induction of tumor cell apoptosis) a smallmolecule, binds p53
|
|
PD-98059
|
MAPK1/2 inhibitor
|
|
Cisplatin
|
chemotherapy drug acts through crosslinking DN
|
|
FAK-inhibitor 14
|
selective inhibitor of focal adhension kinase
|
|
10-DEBC
|
selective inhibitor of Akt
|
|
Chrysin
|
a flavonoid observed to inhibit growth in cancer cells
|
|
TAME
|
tert-Amyl methyl ether; a gasoline additive with suspected toxic effects upon inhalation
|
|
PAC1
|
(pro-caspase activating compound-1), a small-molecule activator of procaspase-3 to caspase-3
|
|
KU0063794
|
specific inhibitor of mTORC1/2
|
|
FPA-124
|
Akt inhibitor
|
|
Compound 401
|
inhibitor of DNA-dependent kinase and mTOR
|
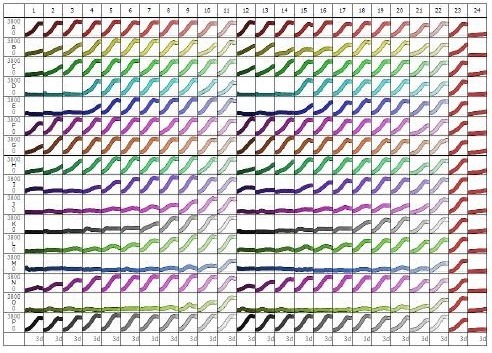
Figure 4. 84-well microplate view of HT-1080 NucLight Green cell proliferation with 16 different compounds, 11-point concentration-response curves in duplicate (different colors, high to low concentrations left to right). Columns 15 and 16 are vehicle (0.5% DMSO) and CHX (3μM) controls, respectively. Note the potent concentration-dependent inhibition of cell proliferation for certain compounds (e.g. row J, row M, row O), and weaker effects/inactivity of others (e.g. row A, row P). Abscissa: time (0-72h), ordinate: fluorescent object count per well (0-3800).
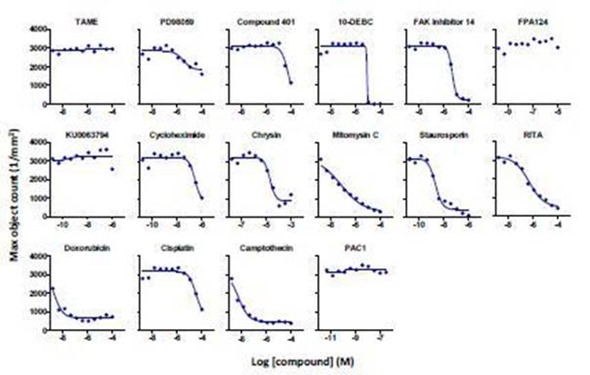
Figure 5. Concentration-response curves for a selected set of literature standard inhibitors of cell proliferation in HT-1080 NucLight Green cells. Abscissa: -log M [compound], ordinate: maximum nuclear count (per mm2). Each point represents the average data from 2 wells from a single 384-well compound plate. The lines of best fit are a 4-parameter logistic equation calculated in GraphPad Prism.
It was observed that FPA-124, TAME, KU0063794, and PAC1 had little to no effect on cell proliferation under the experimental conditions. These findings are further validated by investigating time-lapse videos and representative images of the cells exposed to test compounds at specified concentrations (Figure 6).
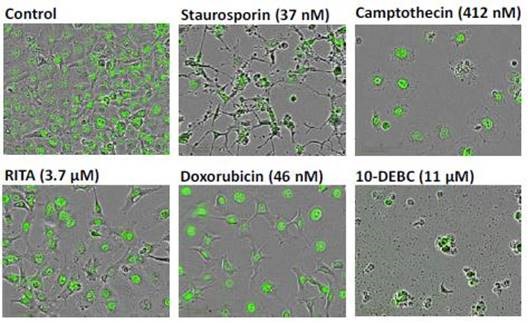
Figure 6. Representative ‘blended’ phase contrast/fluorescence images of HT-1080 NucLight Green cells treated with different test compounds as labeled. Images shown were taken 24 hours post compound treatment (IncuCyte® FLR 10x). Note the reduction in total cell number for each treatment compared to the vehicle control, and the profound differences in cell morphology.
Staurosporine was exposed to an IC80 concentration for 24 hours, which eventually created prominent changes in cell morphology, with significant branching and condensation of the cell body and nucleus.
This resulted in a loss of cell motility, with clear evidence of cytotoxicity. However, no apparent morphological changes were observed during the inhibition of cell proliferation by RITA under the same conditions.
At anti-proliferative concentrations, cells treated with doxorubicin and camptothecin seemed to be healthy without any evidence of cell death. This indicates that senescence had taken place.
Absolute cell lysis and overt cytotoxicity were produced by 10-DEBC (11mM, 24h). These data demonstrate the utility of the morphological and kinetic method for the classification, screening, and prioritization of compounds in drug discovery.
Conclusion
The combination of IncuCyte™ Live-Cell Imaging Systems and NucLight reagents offers a kinetic, live cell assay to determine proliferation. This approach has shown reproducible and quantitative analysis of cells in both monoculture and co-culture. It also provides the ability to observe morphological changes along with quantification. This combination serves as a unique, powerful tool for identifying genetic or pharmacological manipulations that change cell viability.
The above experiments highlight the following points:
It is possible to perform kinetic proliferation assays based on true, direct cell count in both co-culture and monoculture models using NucLight Red and Green cell line. Full-time courses of cell number changes can be monitored and measured, thus further aiding in future experiment planning.
The effects of test conditions can be compared using doubling time and rate constant (k) values, both across and within the cell types. The area under the curve and other such statistical analyses can be established, and there is no need for randomly defined end points.
Proliferation assays can be easily run in 96-well and 384-well microplates with high reproducibility and precision. A mix and read assay is illustrated in 384-well plates, while comparison was made on complete concentration-response curves of 16 standard anti-proliferative agents.
6 x 384-well plates can be observed in the IncuCyte® system, if greater than 2000 wells of parallel data acquisition is achieved.
Separate time-lapse movies or images can be assessed to validate all the time points and data. Observations of cell morphology provide more validation and insight into the mechanistic variations between conditions or treatments.
The IncuCyte® phase and fluorescence live cell imaging technology along with the user-friendly software tools and NucLight reagents and cell lines expressing nuclear restricted green/red fluorescent proteins provide a robust solution for pharmacology assays and kinetic cell proliferation measurements.
Acknowledgements
Produced from materials originally produced by Katherine Artymovich, Kalpana Patel, Clare Szybut, Patricia M. Garay, Tim O’Callaghan, Tim Dale, Del Trezise, and Daniel M. Appledorn from Sartorius – Ann Arbor, Michigan and Welwyn Garden City, U.K.
References
- Straussman R. et al.: Tumour micro-environment elicits innate resistance to RAF inhibitors through HGF secretion. Nature 2012, 487 (7408):500-504.
- Konecny GE, et al. Activity of the dual kinase inhibitor lapatinib (GW572016) against HER-2-overexpressing and trastusumab-treated breast cancer cells. Cancer Res 2006, 66(3):1630-1639.
- Sappal, DS, et al. Biological characterization of MLN944: A potent DNA binding agent. Molec. Cancer Ther. 2004, 3(1):47
- Seynaeve, CM. et al. Differential inhibition of protein kinase C isozymes by UCN-01, a staurosporine analogue. Mol. Pharmacol. 1994, 45(6):1207-1214
- Palom, Y. et al. Bioreductive metabolism of mitomycin C in EMT6 mouse mammary tumor cells: cytotoxic and non-cytotoxic pathways, leading to different types of DNA adducts. The effect of dicumaro. Biochem. Pharamcol. 2001, 61(12):1517-1529.
- Chang, TC et al. Effects of transcription and translation inhbitors on a human gastric carcinoma line. Potential role of Bcl-X(S) in apoptosis triggered by these inhibitors. Biochem. Pharmacol. 1997, 53(7)96-977.
- Roh, JL et al. The p53-reactivating small-molecule RITA enhances cisplatin-induced cytotoxicity and apoptosis in head and neck cancer. Cancer Let. 2012, 325(1):35-41
- Aravena, C et al. Potential Role of Sodium-Proton Exchangers in the Low Concentration Arsenic Trioxide-Increased Intracellular pH and Cell Proliferation. PLoS One 2012, 7(12): e51451
- Hu, W. The anticancer drug cisplatin can cross-link the interdomain zinc site on human albumin. Chem. Commun. 2011, 47(21):6006-6008.
- Cabrita, MA. Focal adhesion kinase inhibitors are potent anti-angiogenic agents. Molec. Oncology 2001, 5(6):517-526.
- Janjetovic, K. Metformin reduces cisplatin-mediated apoptotic death of cancer cells through AMPK-independent activation of Akt. Europ. J. Pharmacol. 2011, 651(1-3):41-50.
- Shao, J et al. AMP-activated protein kinase (AMPK) activation is involved in chrysin-induced growth inhibition and apoptosis in cultured A549 lung cancer cells. Biochem. BioPhys. Res. Comm. 2012, 423(3):448-453.
- Ahmed, FE. Toxicology and human health effects following exposure to oxygenated or reformulated gasoline. Tox. Letters 2001, 123(2-3):89-113.
- Boldingh Debernard, KA. Cell death induced by novel procaspase-3 activators can be reduced by growth factors. Biochem. Biophys. Res. Comm. 2011, 413(2):364-369.
- Garcia-Martinez, JM. Ku-0063794 is a specific inhibitor of the mammalian target of rapamycin (mTOR). Biochem. J. 2009, 421(1):29-42.
- Strittmatter, F et al. Activation of protein kinase B/Akt by alpha1-adrenoceptors in the human prostate. Life Sciences 2012, 90(11-12):446-453.
- Ballou, LM et al. Inhibition of Mammalian Target of Rapamycin Signaling by 2-(Morpholin-1-yl)pyrimido[2,1-α]isoquinolin-4-one. J. Biol. Chem. 2007, 282(33):24463-70.
 Sartorius
Sartorius is a leading international pharmaceutical and laboratory equipment supplier. With our innovative products and services, we are helping our customers across the entire globe to implement their complex and quality-critical biomanufacturing and laboratory processes reliably and economically.
The Group companies are united under the roof of Sartorius AG, which is listed on the Frankfurt Stock Exchange and holds the majority stake in Sartorius Stedim Biotech S.A. Quoted on the Paris Stock Exchange, this subgroup is comprised mainly of the Bioprocess Solutions Division.
Innovative Technologies Enable Medical Progress
A growing number of medications are biopharmaceuticals. These are produced using living cells in complex, lengthy and expensive procedures. The Bioprocess Solutions Division provides the essential products and technologies to accomplish this.
In fact, Sartorius has been pioneering and setting the standards for single-use products that are currently used throughout all biopharmaceutical manufacturing processes.
Making Lab Life Easier
Lab work is complex and demanding: Despite repetitive analytical routines, lab staff must perform each step in a highly concentrated and careful way for accurate results.
The Lab Products and Services Division helps lab personnel excel because its products, such as laboratory balances, pipettes and lab consumables, minimize human error, simplify workflows and reduce physical workloadsSponsored Content Policy: News-Medical.net publishes articles and related content that may be derived from sources where we have existing commercial relationships, provided such content adds value to the core editorial ethos of News-Medical.Net which is to educate and inform site visitors interested in medical research, science, medical devices and treatments.