Cell invasion is a common characteristic of malignant cancers. This plays a central role in tumor metastasis and dissemination, and is largely responsible for deaths related to cancer (1, 2).
Tumor cells have the ability to form a metastatic tumor, and this primarily involves cell morphological reorganization coupled with degradation of the surrounding extracellular matrix (ECM).
The filter based transwell invasion assay (2D) is a conventional in vitro invasion model, and models like this are commonly utilized to assess tumor cell invasion. Their physiological relevance is, however, limited by a lack of thorough cell-ECM interactions.
A more effective alternative is the use of three dimensional (3D) tumor invasion models - such as the one described in this white paper. These may usefully mimic key features of the metastatic phenotype, and better comprehension of this and other mechanisms related to tumor cell invasion may enable better limitation of tumor progression and, most importantly, reduce mortality rates in cancer patients.
The use of such 3D tumor invasion models alongside automated image analysis technology means it is possible to achieve temporal high throughput analyzes of tumor invasion.
The Incucyte® Live-Cell Analysis System is a fully automated brightfield, phase contrast and fluorescence image acquisition and analysis platform. It can be situated within a standard cell culture incubator, allowing for effective maintenance of physiological relevance and optimal cell viability.
This instrument has been developed to allow for the scanning of tissue culture plates and flasks repetitively. This occurs over pre-determined time intervals, allowing users to continuously monitor cultures in order to produce quantifiable, kinetic information.
Additionally, the Incucyte® Spheroid software module functions as a high-speed, adaptable and effective control hub for continuous live-cell analysis incorporating the complete image acquisition, processing and data visualization process.
Assay principle
Within the example study below, the Incucyte® Live-Cell Analysis system and Incucyte® 3D Single Spheroid Invasion Assay were used to examine the capacity and invasive potential of malignant tumor cells.
The Brightfield (DF® Brightfield) image acquisition offers a powerful depth of focus, enabling the real-time acquisition of kinetic imaging of 3D single spheroids embedded in an extracellular matrix (Matrigel™).
Thanks to the improved image acquisition offered, Brightfield images with high contrast can be captured, and these can be easily masked via built-in Incucyte® processing definitions.
Whole spheroid and invading cell areas are plotted automatically over time. These provide a substantial amount of information on both spheroid formation and invasive properties.
The capability to run up to six 96-well plates in parallel means that thousands of images may be rapidly acquired, analyzed, and graphed.
Validation methods are described, alongside data which demonstrates the ability to kinetically visualize and quantify invasive capabilities of a range of cell types, as well as evaluating sensitivity to cell invasion modulating compounds.
Material and methods
Quick guide
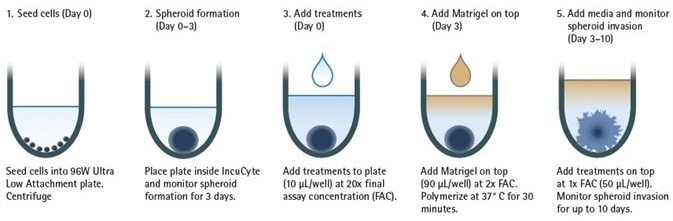
Figure 1. Image Credit: Sartorius
Please note that cell culture reagents were obtained from Life Technologies unless otherwise stated.
U87-MG (ATCC), A172 (ATCC) and HT1080 (ATCC) cells were cultured in F-12K medium supplemented with 10% FBS, 1% Pen/Strep plus 1% Glutamax. These were grown to confluence in 75 cm2 tissue culture treated flasks.
Cells were harvested and seeded into ULA 96-well plates (Corning #7007, SBio #MS-9096UZ, BRAND #781900) so that following 3 days post cell seeding, spheroids were formed with preferred size.
Spheroid formation was monitored in an Incucyte® at 6 hour intervals over a 3 day period. Spheroids were embedded in Matrigel (Corning #356234) once formed. This was done at varying concentrations (2.25 – 4.5 mg/mL) to induce the spheroid invasion assay.
Compounds were purchased from Tocris Bioscience.
Quantifying single spheroid invasive properties over time
U87-MG spheroids which had formed for 3 days, were then embedded in Matrigel (4.5 mg/mL), with actin polymerization inhibitor, Cytochalasin D (Cyto D), both present and absent. DF- Brightfield (DF-BF) images were acquired every 6 hours.
The invasive properties of single spheroids were measured with Incucyte®’s automated spheroid invasion software. This software was able to track and quantify changes in spheroid size – either the whole spheroid area or invading cell area - over time.
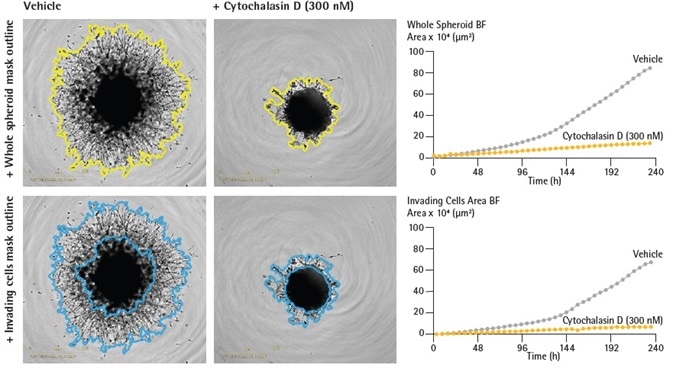
Figure 2. Quantification of single spheroid invasion using Incucyte® real-time analysis. U87-MG cells were seeded in a ULA round bottom 96-well plate (2,500 cells/well) and allowed to form spheroids for 3 days. Spheroids were subsequently treated with vehicle or Cytochalasin D (Cyto D) prior to embedding in Matrigel (4.5 mg/mL). Incucyte® depth of focus brightfield (DF-BF) images (5 d post treatment) show effect of Cyto D on spheroid invasion (whole spheroid; yellow outline mask or invading cells; blue outline mask). Note extensive invasive phenotype of vehicle treated compared to Cyto D treated spheroids. Time-course plots show the individual well BF area (whole spheroid or invading cell areas, μm2) over time (h). Data were collected over a 240 h period at 6 h intervals. All images captured at 4x magnification. Each data point represents mean ± SEM, n=4 wells. Image Credit: Sartorius
Figure 2 demonstrates the software’s ability to precisely segment the invading cell area (blue outline mask) and the whole spheroid area (yellow outline mask) (Figure 2, images).
With Matrigel present, U87-MG control spheroids quickly increased in overall size (whole spheroid area) and displayed notable invasive capabilities over time – as much as a 7-fold increase in invading cell area. Cyto D however, triggered a marked inhibition of spheroid invasion (Figure 2, time-course plots).
Cell type specific spheroid invasive potential
In order to evaluate the metastatic potential of tumor cells in 3D, U87-MG (glioblastoma), A172 (glioblastoma) and HT1080 (fibrosarcoma) spheroids were formed for 72 hours in ULA round bottom 96-well plates. These were then embedded in Matrigel (4.5 mg/mL).
Variations in tumor spheroid invasive properties were kinetically monitored and quantified over a 7 day period.
Invading cell area segmentation (highlighted in blue in Figure 3, images), allowed kinetic quantification of spheroid metastatic potential, while demonstrating the Incucyte®’s ability to accurately differentiate between the invading cell area and spheroid body area throughout an array of cell types.
In order to factor in variation in size after spheroid formation, the whole spheroid area was normalized to spheroid size at t = 0 h, and automatically plotted over time.
Acquired DF-BF images and time-course plots showed cell type specific invasive capabilities. U87-MG spheroids displayed the highest invasive potential.
After 168 hours, whole spheroid area of U87-MG spheroids (ratio: 32) increased to around 2x and 4x the size of HT1080 (ratio: 18) and A172 (ratio: 8) spheroids respectively (Figure 3, whole spheroid area ratio time-course).
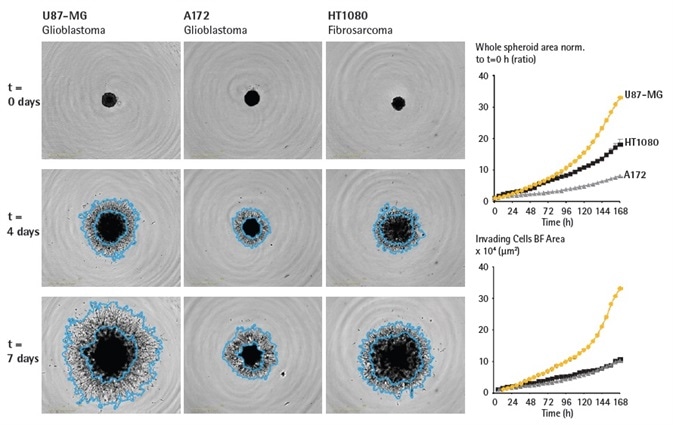
Figure 3. Assess cell type specific invasive capabilities over time. U87-MG, A172 and HT1080 cells were seeded in ULA round bottom 96-well plates (2,500 cells/well; U87-MG, HT1080 or 5,000 cells/well; A172) and allowed to form spheroids (3 d) prior to Matrigel addition (4.5 mg/mL). Brightfield images and timecourses of spheroid area (whole spheroid BF area normalized to t = 0h or invading cell area) show differences in invasive capacity across cell types. Invading cell area mask outline shown in blue, illustrates the extent of invasive capacity. Data were collected over 168 h at 6 h intervals. All images captured at 4x magnification. Each data point represents mean ± SEM, n=4 wells. Image Credit: Sartorius
While they differed in overall size, A172 and HT1080 spheroids displayed similar invasive potential over time (~10 fold at 168 hours) (Figure 3, invading cell area time-course).
Variations in invasive potential shown across cell types, could imply distinct mechanisms of cell motility and invasive modalities1. Further experimentation is needed to better understand mechanisms underlying these disparities.
96-well 3D single spheroid invasion assay for pharmacological analysis
To illustrate the suitability of this specific 3D tumor spheroid invasion assay to anti-metastatic compound testing, a pharmacological study was undertaken in HT1080, U87-MG and A172 cells.
Spheroids (formed 3 days, in ULA round bottom 96-well plates) were treated with a series of invasion modulating compounds before being embedded in Matrigel (2.25 mg/mL or 4.5 mg/mL) to induce invasion (up to 10 days).
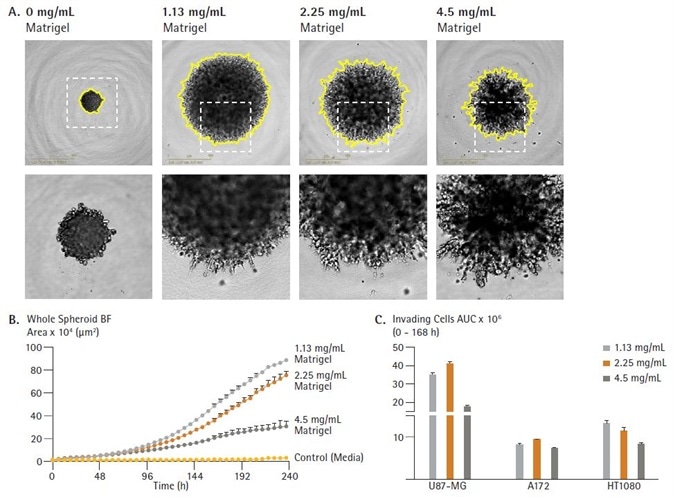
Figure 4. Rapid visualization and assessment of treatment effects using Incucyte® vessel views. U87-MG cells were seeded in ULA round bottom 96-well plates (2,500 cells/well) and allowed to form spheroids (3 d). Spheroids were then treated with serial dilutions of anti-metastatic compounds and embedded in Matrigel (4.5 mg/mL) to induce invasion (up to 10 d). Incucyte® microplate vessel views show effects of treatments on spheroid invasion (whole spheroid area; yellow outline mask) 5d post treatment (A and B). Images captured at 4x magnification. Image Credit: Sartorius
The Incucyte®’s automated, real-time vessel views used alongside its time- course plate view allowed for fast assessment of compound effects on spheroid invasion. Cyto D and PP242 instigated a concentration dependent inhibition of U87-MG spheroid invasion, while minimal effect was noted by Blebbistatin (Figure 5 A, B).
Elucidating treatment effects on single spheroid invasion and proliferation
For 3D in vitro spheroid invasion models to be valid means of assessing the metastatic effects of treatments, they must be able to distinguish effects on both spheroid invasion and spheroid proliferation.
The ability to differentiate between the area covered by cells within the spheroid body and the area covered by the invading cell region (invadapodia) is essential. The example below illustrates how this spheroid invasion application and its accompanying quantification and analysis approaches can achieve this.
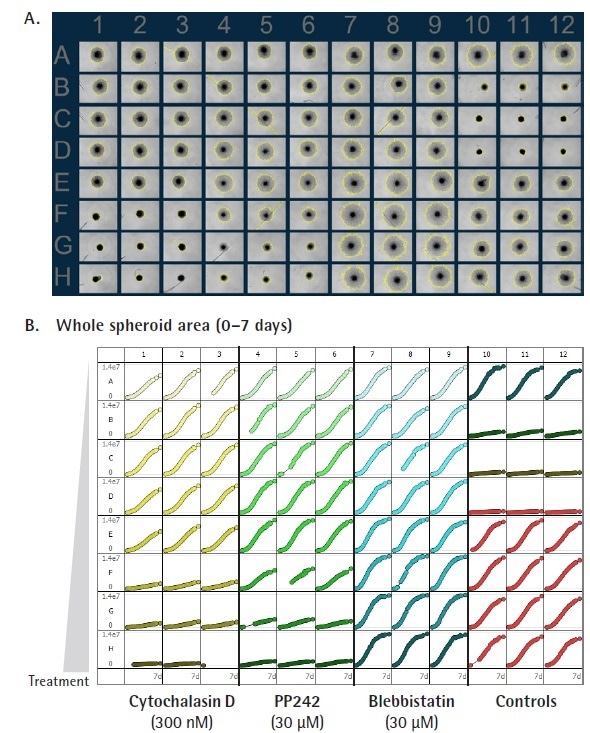
Figure 5. Effect of cell signalling inhibitors on spheroid invasion. U87-MG cells were seeded in a ULA round bottom 96-well plate (2,500 cells/well) and allowed to form spheroids (3 d) prior to treatment with a range of known inhibitors and embedded in Matrigel (4.5 mg/mL). Incucyte® brightfield (BF) images (A) (4 d post treatment) show treatment effects on spheroid invasion. Bar chart (B) represents the area under the curve (AUC) analysis of the whole spheroid and invading cell area (μm2) time-course data (0 -162 h, post treatment). Note the inhibitory and stimulatory effects on invasion caused by Cytochalasin D (Cyto D) and Blebbistatin respectively. Data normalization (96 h post treatment) show effect of Cyto D and PP242 on invading cell regions (C). Subtraction of invading cell area from whole spheroid area (D). In a separate but identical study performed in the absence of Matrigel shows size (BF area) of spheroids 96 h post treatment with Cyto D and PP242 (D). Data were collected over a 162 h period at 6 h intervals. All images captured at 4x magnification. Each data point represents mean ± SEM, n=3. Image Credit: Sartorius
A series of known anti-metastatic compounds were tested to ascertain their effects on U87-MG spheroid invasion. Representative DF-BF images uncovered a broad range of inhibitory effects on spheroid invasion (Figure 6A).
Apart from Blebbistatin, which seemed pro-invasive, all compounds impeded spheroid invasion, showing a reduction in whole spheroid and also invading cell areas (Figure 6B, orange and grey bars respectively).
While similar attenuation of spheroid size was noted with both PP242 (80% at 30 µM) and CytoD (90% at 300 nM), a notable inhibition of the invading cell area (invadapodia) was only clear with Cyto D (Figure 6A, size of blue mask, Figure 6B grey bars).
Normalization of the invading cell area to the whole spheroid area showed that while comparable in total size 96 hours after treatment, 30% (CytoD) and 80% (PP242) of the entire spheroid size was ascribed to the invading cell region (Figure 6C).
By doing a basic subtraction of the invading cell area from the total spheroid area, it was possible to provide a measure for the size of the spheroid body and therefore, a measure for spheroid proliferation within this model of spheroid invasion.
The reduction in the size of PP242 treated spheroids and the similar sizes of both Cyto D and vehicle treated spheroids where Matrigel was absent, provides extra support to the anti-proliferative rather than anti-invasive properties of PP242 (Figure 6D).
In order to validate this approach to analysis, a different study was performed in the absence of Matrigel. This allowed for an assessment of compound effects on spheroid proliferation alone. After they had formed, U87-MG spheroids were treated with compounds for 96 hours.
Effects on spheroid growth and differences in spheroid size (largest BF Area metric) were quantified using the Incucyte®. As can be seen in Figure 6E, this supports and illustrates the inhibitory effects of PP242 (30 µM) but not CytoD (300 nM) on spheroid growth.
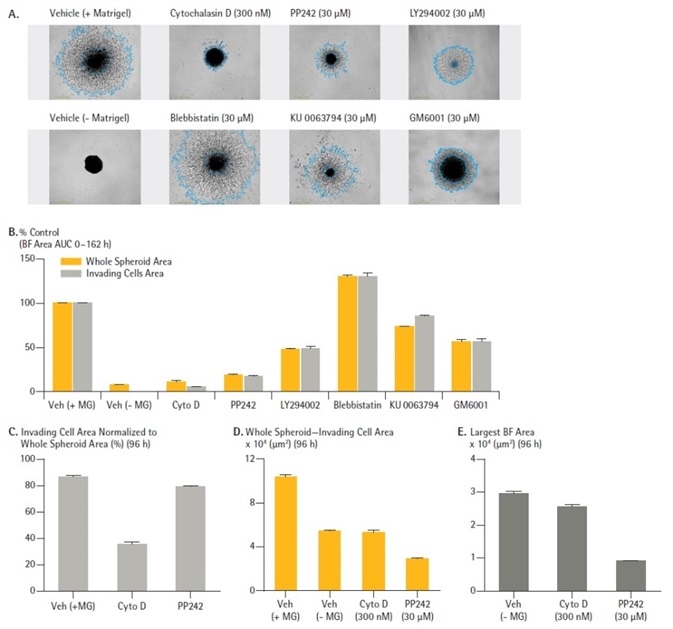
Figure 6. Effect of cell signalling inhibitors on spheroid invasion. U87-MG cells were seeded in a ULA round bottom 96-well plate (2,500 cells/well) and allowed to form spheroids (3 d) prior to treatment with a range of known inhibitors and embedded in Matrigel (4.5 mg/mL). Incucyte® brightfield (BF) images (A) (4 d post treatment) show treatment effects on spheroid invasion. Bar chart (B) represents the area under the curve (AUC) analysis of the whole spheroid and invading cell area (μm2) time-course data (0 -162 h, post treatment). Note the inhibitory and stimulatory effects on invasion caused by Cytochalasin D (Cyto D) and Blebbistatin respectively. Data normalization (96 h post treatment) show effect of Cyto D and PP242 on invading cell regions (C). Subtraction of invading cell area from whole spheroid area (D). In a separate but identical study performed in the absence of Matrigel shows size (BF area) of spheroids 96 h post treatment with Cyto D and PP242 (D). Data were collected over a 162 h period at 6 h intervals. All images captured at 4x magnification. Each data point represents mean ± SEM, n=3. Image Credit: Sartorius
Cell type specific pharmacology
The pharmacology of anti-metastatic compounds was assessed across numerous cell types.
Concentration response curves (CRCs) representing the area under the curve analysis of time-course data were produced (invading cells area, 0 – 168 hours) for CytoD (actin polymerization inhibitor), PP242 (dual mTORC1/2 inhibitor) and GM6001 (MMP inhibitor) (Figure 7).
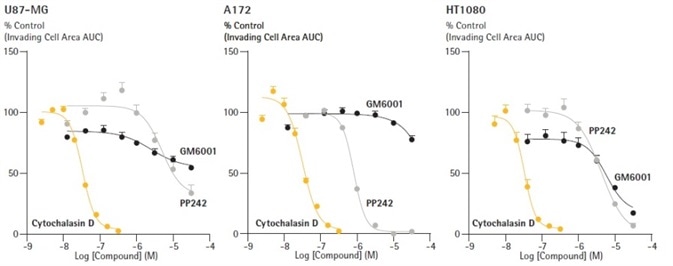
Figure 7. Distinguish pharmacological profiles of anti-metastatic compounds through concentration response curve generation. U87-MG, A172 and HT1080 cells were seeded in ULA round bottom 96-well plates (2,500 cells/well; U87-MG, HT1080 and 5,000 cells/well; A172) and allowed to form spheroids (3 d) prior to treatment. Spheroids were subsequently embedded in 2.25 mg/mL Matrigel and spheroid invasion was monitored for 10 d. Representative concentration response curves (CRCs) of the area under the curve (AUC) analysis of the invading cell area (μm2) (0 – 7 d). Data were collected over a 240 h period at 6 h intervals. Each data point represents mean ± SEM, n=3 separate test occasions. Image Credit: Sartorius
Cytochalasin D was a potent inhibitor of invasion, providing equipotent values for inhibition across all the cell types tested: IC50 30 nM for A172, 30 nM for U87-MG and 28 nM for HT1080.
Concentration dependent inhibition of invasion was noted with PP242 across all cell types (IC50 0.88 µM for A172, 3.2 µM for HT1080, 5 µM for U87-MG).
However, it should be noted that this inhibition was incomplete and partial in U87-MG spheroids (~60% at 30 µM). GM6001 seemed to only trigger inhibition of HT1080 spheroid invasion (IC50 6.3 µM) with limited inhibitory effects on the other cell types examined.
Conclusions
This white paper saw the use of the Incucyte® Live-Cell Analysis System and the Incucyte® Spheroid Software Module, working in tandem to enable kinetic acquisition and quantification of 3D single spheroid invasion.
In summary, the examples provided above have demonstrated:
- The capability of the Incucyte® to kinetically quantify and visualize tumor spheroid invasion properties.
- That live-cell imaging and analysis is capable of revealing cell type specific temporal invasive potential.
- That live-cell imaging and analysis can demonstrate Matrigel concentration-dependent effects on spheroid invasion capacity.
- That the instrument’s suite of metrics and analysis approaches allow for the effects on spheroid invasion and spheroid proliferation to be probed.
- The usefulness of the Incucyte®’s 3D tumor invasion model for real-time compound profiling in a 96-well format, allowing for the identification and distinguishing of new or existing compounds’ effects on tumor invasion.
The Incucyte®’s 3D Single Spheroid Invasion Assay and integrated imaging and analysis solutions are ideal for ensuring reproducible, high throughput analyses of tumor invasion.
As there is no need to select a predefined end-point, the consistent quantification and segmentation of brightfield images facilitates kinetic assessment of single spheroid invasive properties and effects of anti-metastatic agents.
The Incucyte®’s fully automated image acquisition features, coupled with its user-friendly suite of analysis tools and lab tested protocols, means that non-expert users are able to generate reproducible data, perform analysis, and generate publication ready graphics with ease.
When used together, the Incucyte® Live-Cell Analysis System, Spheroid Software Module and reagents offer an effective and novel technical platform that can be easily incorporated into existing workflows.
References
- Oraiopoulou, et al. Integrating in vitro experiments with in silico approaches for Glioblastoma invasion: the role of cell-to-cell adhesion heterogeneity. Nature: Scientific Reports. 2018. 8: 16200.
- Goertzen, et al. Three-Dimensional quantification of spheroid degradation-dependent invasion and invadopodia formation. Biol Proceed Online. 2018; 20:20.
- Ahmadzadeh, et al. Modeling the two-way feedback between contractility and matrix realignment reveals a nonlinear mode of cancer cell invasion. PNAS. 2017; 114 (9) E1617-E1626.
- Gandalovic^ová, et al. MIGRASTATICS, the anti-metastatic and anti-invasion drugs: the promise and challenges. Cell Press. Trends in Cancer. 2017. Vol. 3, No. 6.
Acknowledgments
- Produced from materials originally authored by Miniver Oliver, Kalpana Patel, Sandra Perez, Nevine Holtz, Sanjana Udayashankar and Tim Dale from Essen BioScience
About Sartorius

Sartorius is a leading international pharmaceutical and laboratory equipment supplier. With our innovative products and services, we are helping our customers across the entire globe to implement their complex and quality-critical biomanufacturing and laboratory processes reliably and economically.
The Group companies are united under the roof of Sartorius AG, which is listed on the Frankfurt Stock Exchange and holds the majority stake in Sartorius Stedim Biotech S.A. Quoted on the Paris Stock Exchange, this subgroup is comprised mainly of the Bioprocess Solutions Division.
Innovative technologies enable medical progress
A growing number of medications are biopharmaceuticals. These are produced using living cells in complex, lengthy and expensive procedures. The Bioprocess Solutions Division provides the essential products and technologies to accomplish this.
In fact, Sartorius has been pioneering and setting the standards for single-use products that are currently used throughout all biopharmaceutical manufacturing processes.
Making lab life easier
Lab work is complex and demanding: Despite repetitive analytical routines, lab staff must perform each step in a highly concentrated and careful way for accurate results.
The Lab Products and Services Division helps lab personnel excel because its products, such as laboratory balances, pipettes and lab consumables, minimize human error, simplify workflows and reduce physical workloads
Sponsored Content Policy: News-Medical.net publishes articles and related content that may be derived from sources where we have existing commercial relationships, provided such content adds value to the core editorial ethos of News-Medical.Net which is to educate and inform site visitors interested in medical research, science, medical devices and treatments.