Enhanced in-vitro Alzheimer’s disease (AD) models may offer a deeper understanding of pathology and promising treatments. This article presents many live-cell models that are used for analyzing AD and specifically developed for use on the Incucyte® Live-Cell Analysis System.
Using two-dimensional (2D) and three-dimensional (3D) applications, patient-derived and healthy neuro-progenitor cells were compared. The impact of Tau aggregation and suppression of phosphorylation [(through Okadaic acid (OKA)] in neuronal activity, neurite outgrowth, and cell health was analyzed in primary cortical and cell line models utilizing NeuroBurst® and Annexin V NIR reagents.
hiPSCs and cell lines were used to assess phagocytosis by microglia of pHrodo®-labeled Amyloid-beta (Ap) peptide to study immune interactions.
This data demonstrates that long-term monitoring, together with numerous readouts from sophisticated cellular models, has the ability to deliver a better biological understanding of neurological disorders, thus contributing to the discovery of drugs.
Patient-derived AD PSCs yielded lower neurite processes than healthy controls
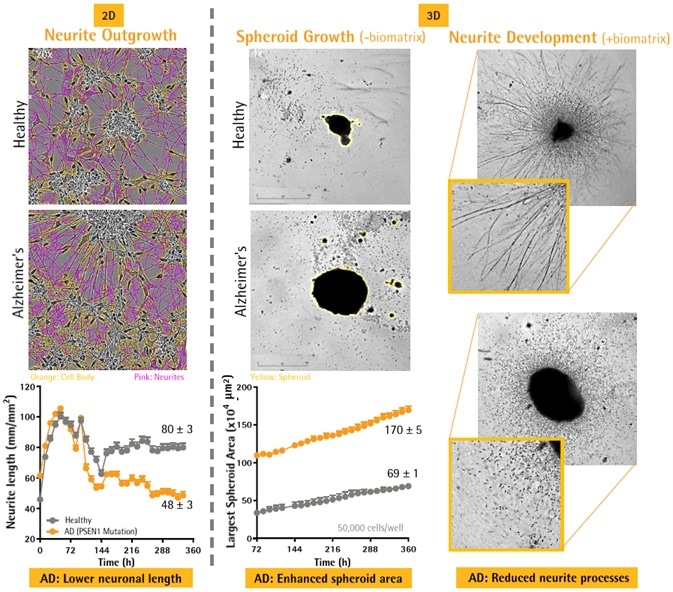
Image Credit: Incucyte®
- Healthy and AD (PSEN1 mutation) derived iPSC neurons from Axol Bioscience.
- 2D plating: ReadySet + SureBond coated 96-well plates at 25,000 cells per well
- 3D plating: ULA 96-well plates at 50,000 cells per well and centrifuged (250 g; 10 minutes). Spheroids were permitted to form for three days.
- Differentiation of neuronal cells was induced in accordance with supplier’s protocol (supplements A + B).
- Cultures were loaded into the Incucyte® Live-Cell Analysis Platform during the course of the research.
- 2D neurite outgrowth: Development was measured with NeuroTrack application (Sartorius) for up to 15 days.
- 3D spheroid growth: Differential in size was measured through Brightfield analysis for up to 15 days.
- 3D neurite development: Matrigel® (2.25 mg/mL) was added at 6 days. Neurite outgrowth and spheroid morphology from the spheroid body was analyzed for an additional 9 days.
- Validation of size and growth potential of spheroids: AD iPSC-derived neurons from Axol Bioscience were seeded as illustrated, at densities of 390–50,000 cells per well.
- As anticipated, the size of the spheroids increased proportionally with seeding density.
- To additionally assess the growth potential, the size of the spheroids was normalized to 72 hours. The growth of the spheroids was inversely dependent on size, with the highest growth rates seen for smaller spheroids.
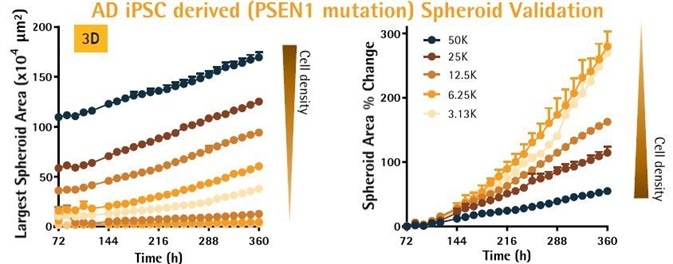
Image Credit: Incucyte®.
Aggregation of Tau peptide induced greater neurotoxicity in primary neurons
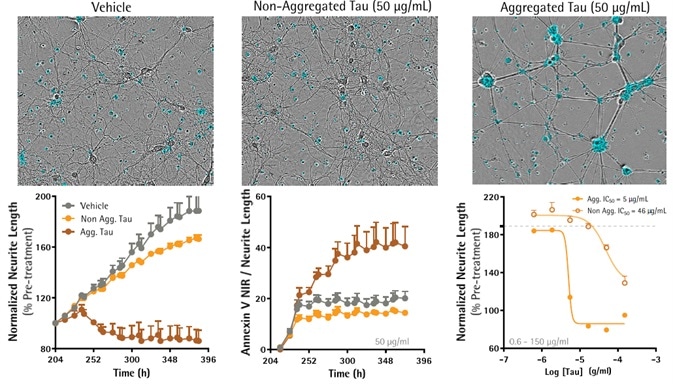
Image Credit: Incucyte®
- Primary rCortical neurons (NeuroPrime®, Sartorius) were seeded in PDL-coated 96-well plates at 20,000 cells per well and loaded into the Incucyte® Live-Cell Analysis System over the course of the studies.
- Eight days post-seeding, cells were treated with aggregated or solubilized Tau (Heparin 4:1 ratio, 37 °C with sporadic rotation for 5 days) in media comprising Annexin V NIR (0.25 μg/mL).
- Neurite outgrowth and cell health (Annexin V NIR) were quantified.
- Aggregated Tau resulted in a concentration-dependent reduction of neurite length (80% ± 5% versus 166% ± 3%, two to three replicates) and increased cell death (40% ± 8% versus 14% ± 1%, three replicates).
- Non-aggregated Tau only caused a substantial suppression of the formation of neurites at 50 μg/mL.
Inhibiting phosphorylation selectively affected neuronal health and outgrowth
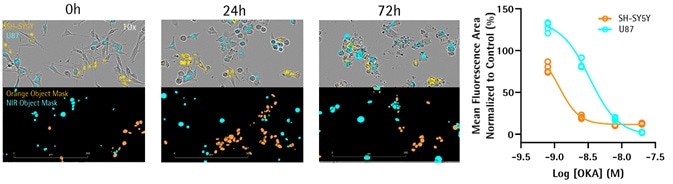
Image Credit: Incucyte®
OKA-induced toxicity in co-culture
- Co-cultures of U87 astrocytic cells and SH-SY5Y neuroblastoma were steadily transfected with NucLight-NIR (Sartorius) or NucLight-Orange, respectively (10,000 cells per well of each type of cells).
- 24 hours post-seeding, cells were treated with OKA — the selective PP1 and PP2A phosphorylation inhibitor (6.25–200 nM) — and fluorescent and phase images were continuously obtained using the Incucyte® Live-Cell Analysis System for 72 hours.
- Representative images after 12.5 nM OKA treatment. Concentration response curves reveal differential toxicity profiles induced by OKA for astrocytes and neurons with a proposed increase in potency for neuronal cells.
OKA decreased neuronal outgrowth in differential SH-SY5Ys in mono-culture
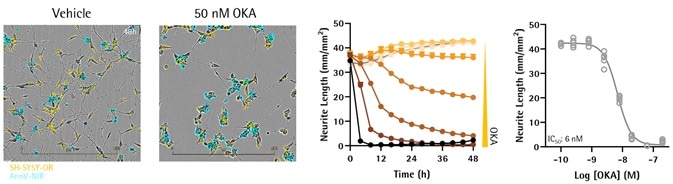
Image Credit: Incucyte®.
- SH-SY5Y cells, which were steadily expressing NucLight-Orange (Sartorius), were seeded in 96-well plates (5000 cells per well). Cell differentiation was done using gradual serum starvation (10% to 0% FBS) as well as sequential addition of atRA (10 μM; 6 days). This was followed by BDNF (50 ng/mL; 6 days).
- On day 14, cells were treated with OKA (1.5–200 nM), in media comprising Annexin V NIR (0.25 μg/mL).
- Using the NeuroTrack application, kinetic quantification of neuronal outgrowth was carried out. OKA caused concentration-dependent suppression of the outgrowth of neurites (IC50 = 6 nM; five replicates).
Tau and OKA toxicity induced loss of Neuronal Activity
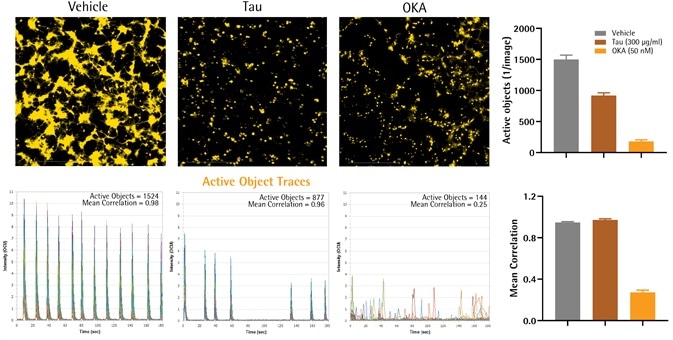
Image Credit: Incucyte®
- rAstrocytes and rCortical neurons (NeuroPrime®, Sartorius) were seeded as a co-culture (15,000 and 20,000 cells per well, respectively) in PDL-coated 96-well plates. The genetically encoded calcium indicator NeuroBurst-Orange from Essen Bioscience, Sartorius, was used to infect neurons to track their spontaneous activity over time by quantifying the fluctuations in calcium. Images were taken in the Incucyte® Live-Cell Analysis System (3-minute scans at three frames per second).
- When functional and mature networks had developed (14 days), cells were treated with the protein phosphatase inhibitor OKA (50 nM), or the AD-related peptide Tau (aggregated, 300 μg/mL).
- Images displayed the active range (maximum-minimum fluorescence) across a complete scan of three minutes. Traces of calcium indicate calcium fluctuation of all active objects within the field of view. In addition, bar graphs offer the correlation (connectivity) and the quantification of the number of active objects (one for each image).
- When compared to vehicle, Tau treatment reduced the number of active nodes (1407 ± 94 versus 920 ± 43 objects per image) as well as their mean intensity (13.7 ± 1.7 versus 7.2 ± 3.6 OCU), without impacting correlation (0.95 ± 0.01 versus 0.97 ± 0.01; two replicates).
- When compared to vehicle, OKA reduced the number of active nodes (180 ± 24 objects per image), their mean intensity (3.8 ± 0.3 OCU), and also correlation (0.27 ± 0.02; six replicates).
Incucyte® System for continuous live-cell analysis
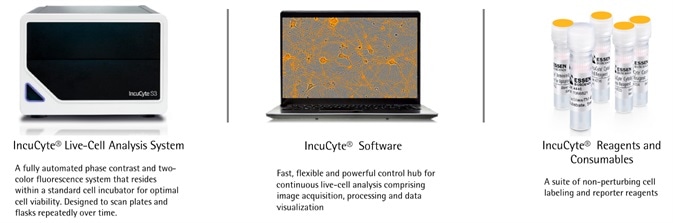
Image Credit: Incucyte®
Studying neuro-inflammation: iPSC microglia engulf aggregated Aβ peptide
Kinetic quantification of phagocytosis by microglia
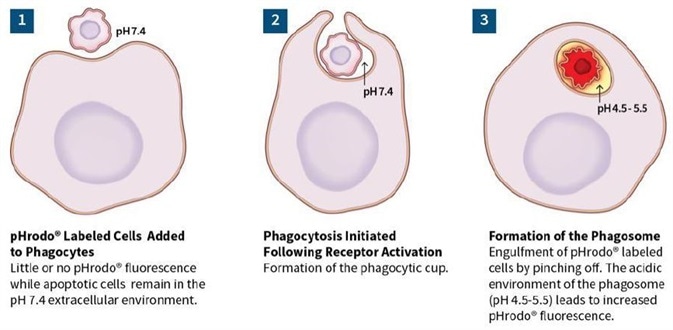
Image Credit: Incucyte®
Phagocytosis of aggregated Aβ peptide (100 μg/mL)
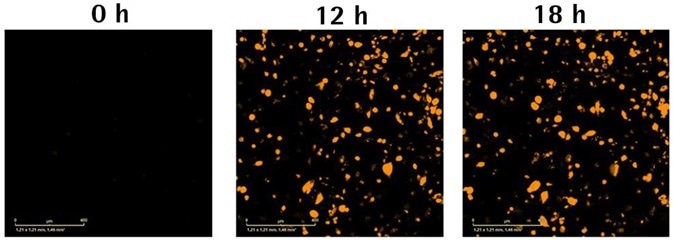
Image Credit: Incucyte®
Engulfment of Aβ is dependent on cell type, peptide aggregation, and concentration
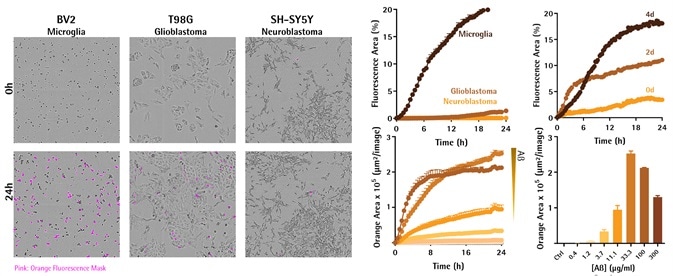
Image Credit: Incucyte®
- Axol Bioscience’s hiPSC microglial precursor cells were first seeded into 96-well plates at 30,000 cells per well and then differentiated to mature microglia for a period of two weeks. Peptides were also labeled using Incucyte® pHrodo® Orange Cell Labeling Kit and aggregates were then created at 37 °C for 48 hours before assay and added to cells (0.4–300 μg/mL). Fluorescent and phase images were obtained in IncuCyte® Live-Cell Analysis System for 36 hours.
- Representative images compare Aβ uptake and changes in morphology between cell lines at 24 hours.
- Kinetic graphs show the cell-type, aggregation, and concentration-dependent reaction to pHrodo®-labeled Aβ peptide over time. Upon comparing different types of cells, fluorescence area was normalized to phase area to account for the changes in cell number and morphology. Bar chart shows the orange area for each concentration at 24 hours.
Elevated cytokine levels observed in AD neurons + microglia iPSC co-cultures
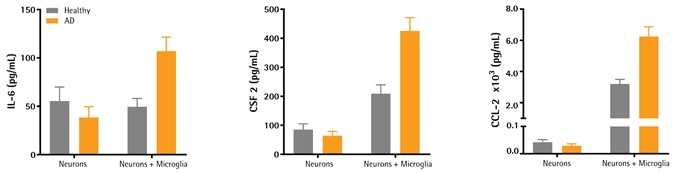
Image Credit: Incucyte®
- As described before (2D Characterization; Figure 1), healthy and AD (PSEN1 Mutation) derived iPSC neurons were plated and differentiated.
- On day 19, Axol Bioscience’s iPSC-derived monocytes were added to the selected wells and then differentiated. On day 30, pernatants were eliminated and cytokine levels related to neuroinflammation were examined using the iQue3® flow cytometer.
- Initial data indicates that when neurons were co-cultured with microglia, the levels of inflammatory cytokines IL-6 (107 ± 15 μg/mL), CSF-2 (425 ± 46 μg/mL), and CCL-2 (6300 ± 227 μg/mL) were reliably higher for the disease phenotype as opposed to healthy controls (50 ± 9 μg/mL, 209 ± 31 μg/mL, and 3190 ± 300 μg/mL, respectively; six replicates).
Acknowledgments
Produced from materials originally authored by S. L. Alcantara, J. N. Rauch, G.Lovell, L. Oupicka, J. Trigg, A. C. Overland, M. L. Bowe, N. Holz, E. Endsley, C. Schramm, D. Appledorn, D. Treize, and T. Dale from Sartorius (Essen BioScience).
About Incucyte®
The Incucyte® Real-Time Quantitative Live Cell Analysis System, designed by Essen BioScience, Inc (now a Sartorius company) is the first system to continuously quantify cell behavior over time (from hours to weeks) while cells remain undisturbed inside a standard incubator. The Incucyte® System automatically collects and analyzes images continuously around the clock, providing insight into active biological processes that is difficult to achieve with endpoint assays. The Incucyte® suite of assays utilize proprietary reagents that do not perturb cell health with validated 96/384 well format protocols that save time and money.
Incucyte® Live-Cell Analysis has revolutionized numerous studies, with applications such as stem cell monitoring and reprogramming, label-free analysis, ATP metabolism, multiplexing, neurite outgrowth and dynamics, migration/invasion, 3D-spheroids, angiogenesis, NETosis, reporter gene expression, immunocytochemistry, immune cell killing, apoptosis, cytotoxicity, kinetic data generation, antibody internalization. All this without the removal of cells from an incubator.
Sponsored Content Policy: News-Medical.net publishes articles and related content that may be derived from sources where we have existing commercial relationships, provided such content adds value to the core editorial ethos of News-Medical.Net which is to educate and inform site visitors interested in medical research, science, medical devices and treatments.