Sponsored Content by SartoriusReviewed by Maria OsipovaApr 30 2025
This research investigates how to optimize mRNA transfection in human T-cells utilizing the jetMESSENGER® transfection reagent. By using advanced bioanalytical instruments like the Incucyte® Live-Cell Analysis System and the iQue® High-Throughput Screening platform, Sartorius detected settings that improve T-cell viability, transfection efficiency, and eGFP expression alike.
Their results show the effective cytotoxic activity of transfected T-cells against A549 cancer cells, underscoring the potential of mRNA-based transfection for medical use cases, particularly in cancer immunotherapy. This study underscores precise T-cell engineering’s critical role in reaching elevated functionality and therapeutic efficacy levels.
Introduction
T-lymphocytes (T-cells) have been identified as critical components of the adaptive immune system, with a critical role in controlling immune responses, the secretion of cytokines, and detecting and getting rid of infected or malignant cells.1
Considerable advancements in understanding T-cells have made way for the development of state-of-the-art therapeutic approaches that have demonstrated outstanding success in multiple domains, such as cancer immunotherapies, autoimmunities, and infectious diseases.1,2
Among the different approaches utilized to employ T-cells for therapeutic effect, chimeric antigen receptor (CAR) T-cells are considered to be outstanding, with significant FDA approvals such as Kymriah and Yescarta for treating B-cell malignancies.3,4 In spite of these therapies’ success, the efficacious manipulation of T-cells for study and medicinal purposes remains a key problem.
Conventional approaches for modifying T-cells include viral vectors, which are more costly and have a more limited cargo capacity in comparison to other approaches, while generating considerable risks, such as insertional mutagenesis and immunogenicity.5
Different approaches like electroporation depend on disrupting membranes, typically leading to low transfection efficiency and excessive cellular damage. Contrasting this, non-viral transfection reagents like lipid-based nanoparticles enable a safer, more cost-effective, and more effective option for T-cells and other difficult-to-transfect cellular varieties .5,6
Alongside the intracellular delivery approach, the variety of genetic material should also be considered carefully. Recently, mRNA has arisen as a crucial part of genome-editing strategies owing to its capacity to engender precise and efficient improvements without integrating into the host genome.7
mRNA transfection is especially beneficial for T-cells, permitting the rapid and efficient production of necessary functional proteins. This strategy has demonstrated significant potential both in medicinal use cases and in T-cell biology research.
Modifying gene-delivery approaches for T-cells is critical for improving their potential in medicine. With this requirement, the principal goal of this research was to modify the transfection of human T-cells with mRNA utilizing the jetMESSENGER® transfection reagent.
In particular, Sartorius wanted to identify the settings needed for optimizing cell proliferation, transfection efficiency, and cytotoxic activity against cancer cells. T-cells were prepared in specialized 4Cell® Nutri-T GMP media alongside high-quality cytokines from Sartorius to enable both their recovery and expansion.
For kinetic visualization and quantitative tests guiding the optimization process, Sartorius used the Incucyte® LiveCell Analysis System and the iQue® High-Throughput Screening (HTS) cytometer.
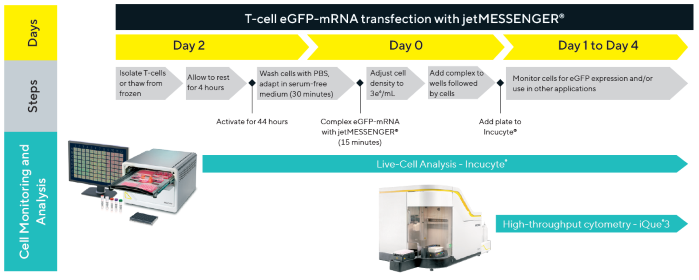
Figure 1. T-cell transfection workflow. A workflow diagram highlighting the key steps involved in eGFP-mRNA transfection of T-cells using jetMESSENGER®, including timepoints for cell monitoring, sampling, and analysis. Image Credit: Sartorius
Materials and methods
The T-cell transfection workflow schematic (Figure 1) highlights various steps in the transfection process and underscores critical points in the timeline for tracking and analyzing cells.
Cell culture and T-cell activation
Human primary T-cells obtained from healthy donors were thawed after being frozen according to the vendor’s guidelines utilizing 4Cell® Nutri-T GMP media supplemented with FBS for more support while thawing (Table 1). The cells were suspended again to a density of 1.5 × 10⁶ cells/mL and supplemented with either IL-2 or IL-21.
After adding cytokines, the T-cells were set aside to rest for 4 hours in a 37 °C, 5 % CO2-humidified incubator. To activate and proliferate the cells, T-Cell TransAct™ was added, and the cells were then incubated for 44 hours more under the aforementioned settings.
Incucyte® Cytolight Red A549 adenocarcinoma cells that stably expressed a cytoplasmic red fluorescent protein were preserved in F-12K media (Table 1) and utilized as target cells in the immune cell killing assay. The media formulations and materials utilized in the workflow are showcased in Table 1 and Table 2.
T-cell proliferation studies comparing IL-2 and IL-21
Research was carried out utilizing the protocol demonstrated in the T-cell transfection workflow shown in Figure 1.
On day 0 of the workflow, T-cells were washed with phosphate-buffered saline (PBS) (300 x g, 5 mins) and suspended once again in 4Cell® Nutri-T GMP media at a density of 3 x 10⁶ cells/mL. The cells were equilibrated to serum-free settings for 30 minutes in a 37 °C, 5 % CO2 humidified incubator prior to being seeded into a 96-well plate (187,500 cells/ well).
After a 30-minute cell-settling period at room temperature, the plate was put in the Incucyte® LiveCell Analysis System (Incucyte® system) to track proliferation. After 3.5 hours, the plate was taken away briefly to include fresh media carrying either IL-2 or IL-21 and TransAct™ to the wells. Monitoring proliferation continued in the Incucyte® system until full cell confluence was achieved.
High-definition (HD) phase contrast images were obtained at 3-hour intervals via a 20x objective (4 images/well) and examined with the integrated Incucyte® Cell-By-Cell Analysis Software Module or the Incucyte® AI Confluence Analysis software (offered via the Incucyte® Base Analysis Software).
Table 1. Media formulations used for cell culture. Source: Sartorius
| Media Component |
Supplier |
Cat. No. |
Nutri-T Media |
F-12K Media |
| 4 Cell® Nutri-T GMP media |
Sartorius |
05-F3F2111-1K |
Base |
|
| Ham’s F-12K (Kaighn’s) |
Gibco |
21127030 |
|
Base |
| Characterized Fetal Bovine serum (FBS) |
Sigma-Aldrich |
F2442-500ML |
10% |
10% |
| Penicillin-Streptomycin (P/S) |
Gibco |
15140122 |
1% |
50 μM |
| Puromycin |
Gibco |
A1113803 |
|
0.5 μg/mL |
| Interleukin-2 (IL-2) |
Sartorius |
CYK-0025-1001 |
10 ng/mL |
|
| Interleukin-21 (IL-21) |
Sartorius |
CYK-0025-1018 |
10 ng/mL |
|
Table 2. Materials required for transfection and assays. Source: Sartorius
| Materials |
Supplier |
Cat. No. |
Final concentration |
| Human Pan T-cells, CD3+ |
ZenBio |
SER-CD3-PANT10-F |
|
| T Cell TransAct™ |
Miltenyi Biotec |
130-128-758 |
10 μL per 1.10e6 cells |
| CleanCap® eGFP mRNA |
TriLink |
L-7601 |
|
| jetMESSENGER® |
Sartorius |
101000056 |
|
| Incucyte® Opti-Green Background Suppressor |
Sartorius |
N/A |
|
| Costar™ 96-well plate bottom plate |
Corning |
3595 |
|
| Corning® 25 cm2 cell culture flask |
Corning |
430639 |
|
| iQue® Human T Cell Activation Kit |
Sartorius |
90560 |
|
| iQue® Cell Membrane Integrity Dye (B/Red) Kit |
Sartorius |
90346 |
1 in 100 dilution |
| Incucyte® Cytolight Red Lentivirus (EF-1α, Puro) |
Sartorius |
N/A |
|
T-cell transfection
Transfection was carried out on day 0 (Figure 1). T-cells were washed and then equilibrated in media as outlined in the proliferation research. Over the 30 minutes during equilibration, mRNA was complexed with the jetMESSENGER® transfection reagent.
Rising concentrations of CleanCap® eGFP mRNA (Table 2) were blended with jetMESSENGER® at a ratio of 1 µg mRNA to 3 µL transfection reagent and incubated for 15 minutes at room temperature. The mRNA-jetMESSENGER® complex was added to a 96-well plate, followed by equilibrated T-cells (187,500 cells/well).
The plate was lightly rocked to enable proper mixing and then left to settle at room temperature for 30 minutes prior to being placed in the Incucyte® system for both proliferation and monitoring transfection.
After 3.5 hours, the plate was removed for a short period of time to add fresh media with IL-21 and TransAct™ to the wells. Where necessary, a Sartorius Opti-Green background suppressor was added to the wells to remove green autofluorescence from the media.
Proliferation and transfection tracking continued in the Incucyte® system until full well coverage was achieved. HD phase contrast and green fluorescence images were obtained and examined as earlier outlined.
High-throughput cytometry assessments
To aid further examination, wells from transfection tests were sampled on both day 1 and day 2 for analysis via the iQue® HTS platform utilizing the integrated iQue Forecyt® software.
Cells were washed and stained according to the manufacturer’s guidelines to examine viability, immunophenotyping, T-cell activation, and transfection efficiency. The reagents utilized for these tests are available in Table 2 and include the iQue® Human T Cell Activation Kit and the iQue® Cell Membrane Integrity Dye (B/Red) Kit.
Immune cell killing assay
To examine the tumor-killing ability of transfected T-cells, an immune cell-killing assay was carried out with the Incucyte® SX5 system. Cytolight Red A549 target cells were seeded at 5K cells/well into a 96-well plate in 4Cell® Nutri-T GMP medium topped up with FBS.
Cells were permitted to adhere for 3 hours in a 37 °C, 5 % CO2 humidified incubator. Throughout this period, T-cells transfected for 24 hours were pooled and centrifuged (300 x g, 5 mins), and the resultant pellet was suspended again in fresh media with IL-21. Following target cell attachment, the media was replaced with transfected T-cells at either 5:1, 10:1, or 20:1 effector-to-target (E:T) ratios.
As a last step, fresh media supplemented with IL-21 and TransAct™ was added to the wells prior to being placed in the Incucyte® system for T-cell cytotoxic activity tests. Orange fluorescence and HD phase contrast images were gathered every hour (20x objective, 4 images/ well) and examined with the Incucyte® Classic Confluence.
Analyzing orange fluorescence area/well and orange green fluorescence overlap area/well for quantitative assessments of target cell number and E:T interactions..
Results
Using live-cell analysis and HTS cytometry for T-cell characterization
Many cytokines are widely utilized for T-cell culture, with IL-2 and IL-21 being the most commonly used. IL-2 is known to enable both T-cell proliferation and activation. Meanwhile, IL-21 is linked to improving effector function.
To contrast T-cells cultured with IL-2 versus IL-21, cells were seeded into a 96-well plate and tracked for proliferation as shown in Figures 2A and 2B. Furthermore, wells were sampled at 24 hours for viability, phenotypic, and functional analysis utilizing the iQue® HTS platform shown in Figure 2C.
The images and kinetic growth curves (Figures 2A and 2B) demonstrate how the proliferation dynamics of T-cells were similar for IL-2 and IL-21, with growth curves demonstrating small differences and overlapping exponential rates and plateaus. Data gathered utilizing the iQue® HTS platform shown in Figure 2C supported this data, demonstrating similar percentages of viable cells for the two cytokines (86.3 ± 1.8% and 87.9 ± 0.7% for IL-2 and IL-21).
Immunophenotyping showed similar percentages of CD3 T-cells, alongside CD4 and CD8 subsets. For instance, the percentage of CD8 T-cells stood at 39.2 ± 0.5% for IL-2 and 38.1 ± 0.68% for IL-21. Among the CD8 subset, the percentage expressing the late activation marker CD25 was also similar (35.2 ± 1.0% and 39.0 ± 2.3% for IL-2 and IL-21).
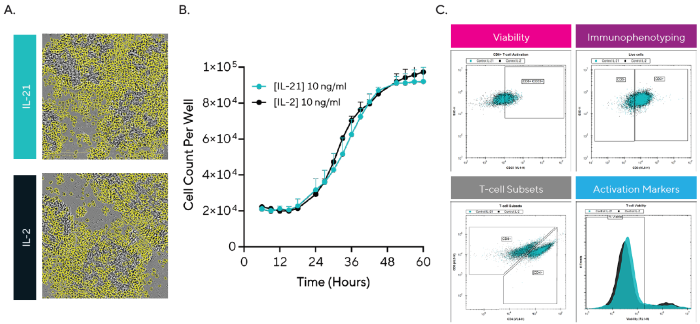
Figure 2. Using Live-cell Analysis and HTS Cytometry for T-Cell Characterization in the presence of IL-2 or IL-21 Cells were monitored over 60 hours using live-cell analysis and HTS cytometry. A) HD phase-contrast images and Cell-by-Cell segmentation showing T-cells at 36 hours. B) Kinetic T-cell proliferation profile for both cytokines. C) Representative histograms and scatter plots showing T-cell characterization gating strategies at 24 hours. Data are presented as mean ± SEM with n = 1 donor (2-6 replicates, 4 images per well). Image Credit: Sartorius
References and further reading
- Sun, L., et al. (2023). T cells in health and disease. Signal Transduction and Targeted Therapy, (online) 8(1). https://doi.org/10.1038/s41392-023-01471-y.
- Waldman, A., Fritz, J. and Lenardo, M. (2020). A guide to cancer immunotherapy: from T cell basic science to clinical practice. Nature Reviews Immunology, 20(20), pp.1–18. https://doi.org/10.1038/s41577-020-0306-5.
- U.S. Food & Drug Administrations. KYMRIAH (tisagenlecleucel). https://www.fda.gov/vaccinesblood-biologics/cellular-gene-therapy-products/ kymriah-tisagenlecleucel.
- FDA (2025). US food and drug administration. (online) Fda.gov. Available at: https://www.fda.gov/.
- Stewart, M., et al. (n.d.). Publisher: NPG; Journal: Nature: Nature; Article Type: Review. [online] https://doi.org/10.1038/nature19764.
- Chong, Z.X., Yeap, S.K. and Ho, W.Y. (2021). Transfection types, methods and strategies: a technical review. PeerJ, (online) 9. https://doi.org/10.7717/peerj.11165.
- Qin, S., et al. (2022). mRNA-based therapeutics: powerful and versatile tools to combat diseases. Signal Transduction and Targeted Therapy, (online) 7(1), pp.1–35. https://doi.org/10.1038/s41392-022-01007-w.
 Download the article to learn more
About Sartorius
Sartorius is a leading international pharmaceutical and laboratory equipment supplier. With our innovative products and services, we are helping our customers across the entire globe to implement their complex and quality-critical biomanufacturing and laboratory processes reliably and economically.
The Group companies are united under the roof of Sartorius AG, which is listed on the Frankfurt Stock Exchange and holds the majority stake in Sartorius Stedim Biotech S.A. Quoted on the Paris Stock Exchange, this subgroup is comprised mainly of the Bioprocess Solutions Division.
Innovative technologies enable medical progress
A growing number of medications are biopharmaceuticals. These are produced using living cells in complex, lengthy and expensive procedures. The Bioprocess Solutions Division provides the essential products and technologies to accomplish this.
In fact, Sartorius has been pioneering and setting the standards for single-use products that are currently used throughout all biopharmaceutical manufacturing processes.
Making lab life easier
Lab work is complex and demanding: Despite repetitive analytical routines, lab staff must perform each step in a highly concentrated and careful way for accurate results.
The Lab Products and Services Division helps lab personnel excel because its products, such as laboratory balances, pipettes and lab consumables, minimize human error, simplify workflows and reduce physical workloads.
Sponsored Content Policy: News-Medical.net publishes articles and related content that may be derived from sources where we have existing commercial relationships, provided such content adds value to the core editorial ethos of News-Medical.Net which is to educate and inform site visitors interested in medical research, science, medical devices and treatments.