An increasing amount of research indicates that more translational and appropriate observations can be made with organoids and micro-tissues in comparison with 2D monolayer cell models. This is most widespread in the hepatotoxicity and cancer biology fields.
For instance, tumor spheroids have a hypoxic core and display more appropriate morphology and enhanced survival of cells in comparison with 2D cultures.
Modern techniques for evaluating the shrinkage and growth of tumor spheroids are restricted by one or more of the following: (1) assay workflows that are laborious, time-consuming, or expensive, (2) a need for cell labeling (such as a fluorescent probe) which can disturb the biology and may not be suitable for primary tissue, (3) single time-point readouts that do not observe the complete duration, (4) indirect readouts (such as ATP) which may miss important morphological data and/or inaccurately report cell growth.
In this white paper, validation data and methods will be provided for miniaturized (96/384-well) live-cell tumor spheroid assays that are established on non-invasive bright-field image analysis carried out using the Incucyte® S3 Spheroid software module.
Tumor spheroids are produced in ultra-low attachment (ULA) plates and observed for morphology and size for up to 2 weeks. These assays are simple to run, dynamic, and deliver direct and automated measurements of tumor size in real-time.
Materials and methods
Protocol

Figure 1. Assay Workflow. Image Credit: Sartorius
- Cells of interest are counted, harvested and plated into ULA round-bottom 384- or 96-well plates at the intended densities (in 50 or 100 µL per well for 384- or 96-well plate respectively). The plates are then centrifuged (150xg, 10 minutes).
- The formation of the spheroid is tracked to the target size (for example 200 to 500 µm) with HD phase-contrast image scans and 6-hour bright-field image scans (either 10x or 4x magnification) utilizing the Incucyte® S3 Spheroid software module.
- Compounds are included (100 µL at 2x, or 25 µL at 3x final assay concentration (FAC) per well for 96- or 384-well plate respectively).
- The spheroid shrinkage and growth assay is started and observed in the Incucyte® (6-hour consistent scanning, for up to 2 weeks). Tumor size is evaluated in real-time founded on brightfield image analysis and contrasted to fluorescence evaluation of Incucyte® NucLight Red label.
Incucyte® NucLight Red Cellular Reagents (MDA-MB-231-NR, EssenBio #4487; A549-NR #4491; SKOV3-NR, not commercially available and HT-1080-NR, #4485) were developed to confluence in 75 cm2 tissue culture treated flasks.
They were subsequently seeded into 384-well (S-Bio #MS-9384UZ) or 96-well (Corning #7007) ULA round-bottom plates so that spheroids had grown to the intended size after 72 hours (for example 200 to 500 µM).
The plates were then centrifuged (150xg, 10 minutes) at room temperature. The inclusion of a basement membrane extract, Matrigel® (Corning #356234) at 2.5% v/v, was required by the MDA-MB-231 cells to ensure the tight formation of the spheroid.
Each of the cells were cultured in F-12K supplemented with 0.5 µg/mL puromycin, 1% glutamax, 1% Pen/Strep, and 10% FBS. Each of the cell culture reagents were acquired from Life Technologies unless stated otherwise. The formation of spheroids was tracked in an Incucyte® Live-Cell Analysis System throughout a period of 72-hours at 6-hour intervals.
Validation data
Spheroid morphology
To initially demonstrate the efficacy of the Incucyte® imaging technique, human breast (MDA-MB-231 in Matrigel®) and lung (A549) tumor cell lines were seeded at 2,500 or 5,000 cells per well respectively in 96-well ULA plates (Corning). Bright-field (BF) and High Definition (HD) phase images were acquired at 6-hour intervals (Figure 2).
Distinct morphological variations were observed. MDA-MB231 spheroids were compact and small, while A549 cells formed looser, larger aggregates. These features are in harmony with those previously published elsewhere.
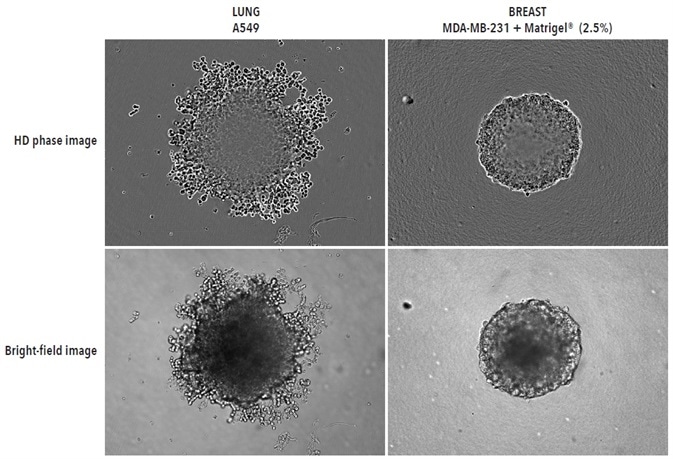
Figure 2. Visualizing different spheroid morphologies. High quality HD phase and corresponding BF images of spheroids formed from A549 and MDA-MB-231 cells (2,500 or 5000 cells per well respectively), 72-hours post seeding. Visualization of detailed phenotypic variation is observed in HD phase images. A549 cells present a loose aggregate morphology compared to the compact spheroid formed by MDA-MB-231 cells. Compaction of MDA-MB-231 aggregates into spheroids was achieved by the addition of 2.5% v/v Matrigel® post centrifugation. All images captured at 10x magnification. Image Credit: Sartorius
IncuCyte® BF size analysis
Tumor spheroid size was quantified utilizing an automated software algorithm that shielded the biggest BF object in the field of view. Assay information was contrasted to an ATP-endpoint viability assay and a fluorescent labeling technique to validate the BF masking method.
Stably expressing red fluorescent protein (Incucyte® NucLight Red Cellular reagent, cat # 4491), the A549 cells were seeded at a range of densities (625, 2,500 or 7,500 cell per well) in ULA round-bottomed plates to produce spheroids of various sizes.
Fluorescent and BF images were captured, masked, and investigated utilizing Incucyte®. Comparisons of fluorescent and BF segmentation showed spheroid sizes that were highly alike, assisted by visual examination of the masks and images (Figure 3). The quantified spheroid area corresponded to the initial density of cell seeding.
At the end of the investigation (180 hours after spheroid formation), an ATP end-point viability assay (CellTiter-Glo 3D, Promega # G9681) was carried out following the instructions of the manufacturer.
Spheroids were pipette mixed after five minutes of incubation, and moved into solid white, flat-bottomed plates (Corning #3917). They were then incubated for a further 25 minutes before luminescence measurement on a CLARIOstar microplate reader (BMG) to produce ATP relative luminescent units (RLU) values.
As predicted, the luminescence signal became stronger with the seeding cell number, but the fold increase was less significant than what was noted for spheroid area (Figure 3). This may be due to differences in cell metabolism after the formation of spheroids, especially after the spheroid develops a hypoxic core and becomes bigger.
![Fluorescent and [ATP] readouts support BF segmentation. Seeding density dependent spheroid growth of A549 NucLight Red cells. A549 NucLight cells were plated at a density of 625, 2,500 or 7,500 cells per well in ULA round-bottom 96- well plates. Spheroids were allowed to form followed by media replenishment 72-hours post seeding. BF and FLU images show segmentation mask of representative wells at 120-hours post-media replenishment. The bar graph demonstrates the correlation of the Largest BF and fluorescence Object area (µm2) as well as the [ATP] (Relative luminescent units, RLU) end-point analysis with increasing cell seeding density at 180-hurs. Data were collected over a 180-hour period at 6-hour intervals. All images captured at 10x magnification. Each data point represents mean ± SEM, Fluorescent and [ATP] readouts support BF segmentation. Seeding density dependent spheroid growth of A549 NucLight Red cells. A549 NucLight cells were plated at a density of 625, 2,500 or 7,500 cells per well in ULA round-bottom 96- well plates. Spheroids were allowed to form followed by media replenishment 72-hours post seeding. BF and FLU images show segmentation mask of representative wells at 120-hours post-media replenishment. The bar graph demonstrates the correlation of the Largest BF and fluorescence Object area (µm2) as well as the [ATP] (Relative luminescent units, RLU) end-point analysis with increasing cell seeding density at 180-hurs. Data were collected over a 180-hour period at 6-hour intervals. All images captured at 10x magnification. Each data point represents mean ± SEM,](https://www.news-medical.net/image-handler/picture/2020/4/2821_Art3_Pic3.jpg)
Figure 3. Fluorescent and [ATP] readouts support BF segmentation. Seeding density dependent spheroid growth of A549 NucLight Red cells. A549 NucLight cells were plated at a density of 625, 2,500 or 7,500 cells per well in ULA round-bottom 96- well plates. Spheroids were allowed to form followed by media replenishment 72-hours post seeding. BF and FLU images show segmentation mask of representative wells at 120-hours post-media replenishment. The bar graph demonstrates the correlation of the Largest BF and fluorescence Object area (µm2) as well as the [ATP] (Relative luminescent units, RLU) end-point analysis with increasing cell seeding density at 180-hurs. Data were collected over a 180-hour period at 6-hour intervals. All images captured at 10x magnification. Each data point represents mean ± SEM, n=4. Image Credit: Sartorius
Growth and shrinkage over time
Variations in the size of A549, HT-1080, and MDA-MB-231 tumor spheroids were observed over time, in the presence and absence of the cytotoxic drug, camptothecin (CMP; Figure 4).
The control spheroids significantly increased over the duration of 10-days for all three cell types (2-8 fold). The biggest increase in size was noted with MDA-MB-231 in Matrigel®. CMP limited the growth of spheroids, and in the example of HT-1080 cells, a total decrease in spheroid size in comparison with the t= zero control was noted.
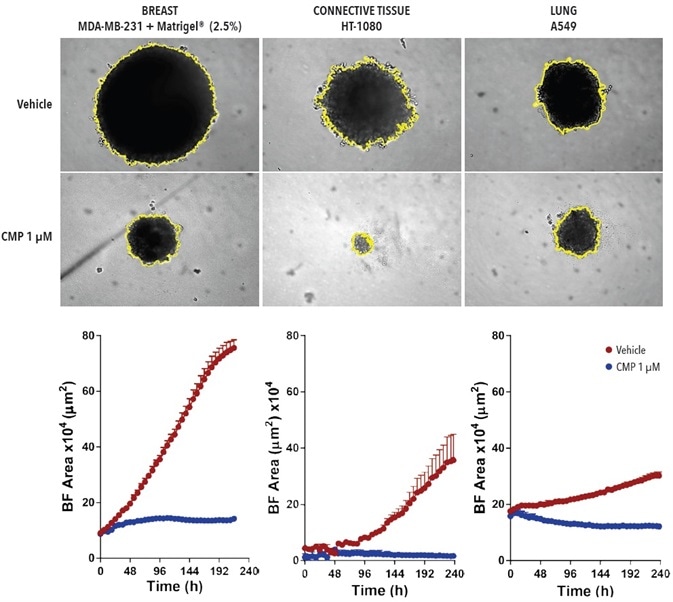
Figure 4. BF analysis enables accurate kinetic quantification of spheroids. The differential pharmacological effect of 1 µM CMP on growth of MDA-MB-231, HT-1080 and A549 cells in a spheroid assay. Cells were grown in ULA roundbottom 96- well plates (2,500 cells per well) for 72-hours and treatment with ± 1 µM CMP followed. Segmented BF images compare treated vs. un-treated conditions at 240-hours. Time-courses illustrate the specific cell type-dependent kinetic profile of spheroid growth and shrinkage. The graphs display the Largest BF Object area (µm2) (y-axis) over the course of a 240-hour assay (x-axis) at 6-hour intervals. All images captured at 10x magnification. Each data point represents mean ±SEM, n=4. Image Credit: Sartorius
96-well spheroid growth and shrinkage assay
To demonstrate the relevance of this method for drug toxicity testing, a pharmacological investigation was carried out in SKOV-3 and A549 cancer cell lines. Each of the cell types were developed for 72-hours in ULA round-bottom 96-well plates and were then treated with the test compound.
The influence of CMP (0.457 nM to 1 µM) on A549 cells was evaluated (Figure 5). Spheroid shrinkage and growth was measured on the Incucyte® by assessing differences in spheroid area, utilizing the Largest BF Object Area (µm2) metric.
Here, a concentration dependent effect of CMP on the shrinkage of spheroids in A549 spheroids is shown.
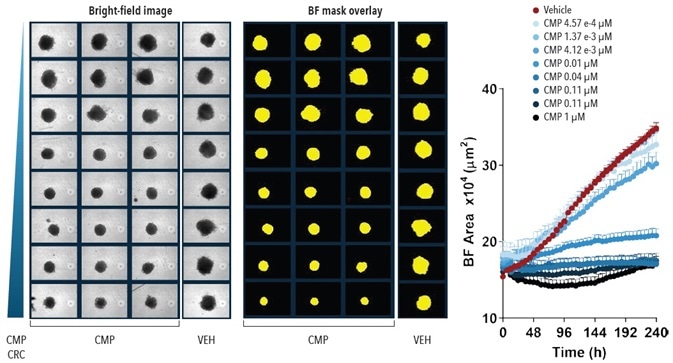
Figure 5. Quantification Spheroid Growth and Shrinkage. Effect of CMP on growth of A549 cells in a spheroid assay. A549 cells were plated at a density of 5,000 cells per well and spheroid allowed to form (72-hours). Serial dilutions of CMP were then added to the cells and the kinetics of spheroid growth and shrinkage were measured. Images represent the BF view and segmentation at t=240-hours. Time-course plot shows the Largest BF Object Area metric (µm2) over time for all wells. Data were collected over a 240-hour period at 6-hour intervals, all images captured at 10x magnification. Each data point represents mean ±SEM, n=3. Image Credit: Sartorius
SKOV-3 cells were treated with the chemotherapeutic drug oxaliplatin (OXA), the apoptotic compound cisplatin (CIS), or the cytotoxic compound CMP in the second investigation (Figure 6).
The results demonstrate an inhibitory growth effect dependent on concentration for all compounds and shows how the potencies of each compound can be directly contrasted inside the same assay.
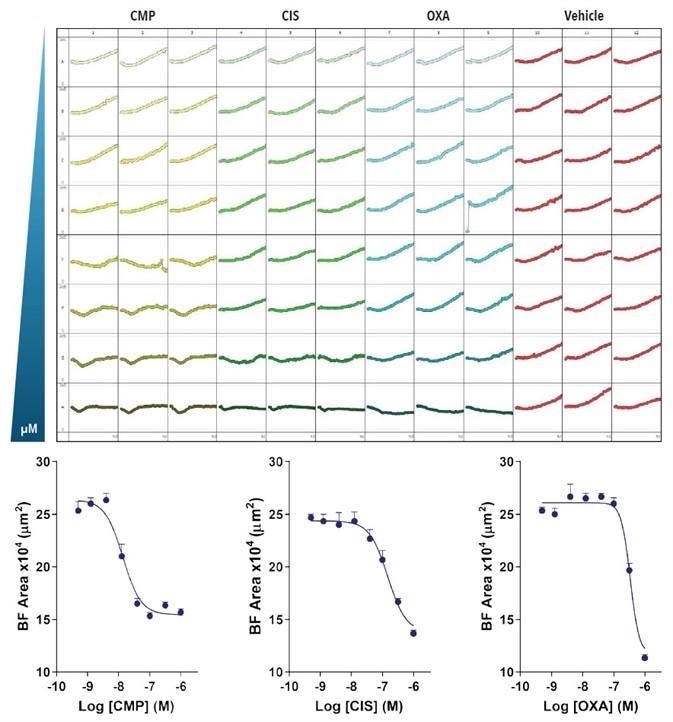
Figure 6. Effect of CMP, CIS and OXA on growth of SKOV3 cells in a spheroid assay. SKOV3 cells were plated at a density of 5,000 cells per well and spheroid allowed to form (72-hours). Cells were then treated with serial compound dilutions and kinetics of spheroid growth and shrinkage were obtained. Plate-view shows the individual well Largest BF area (µm2) over time. Concentration response curves represent the Largest BF area (µm²) at 204-hours post-treatment. Data were collected over 240-hour period at 6-hour intervals. Each data point represents mean ±SEM, n=8. Image Credit: Sartorius
Intra- and inter-plate reproducibility
A series of independent studies utilizing A549 cells and ± 1 µM CMP were carried out to evaluate the precision and reproducibility of the Incucyte® BF analysis tool (10x magnification, Figure 7). After spheroids had developed (72-hours), growth was observed and evaluated for an additional 180 hours.
The microplate overview image and the variability plot analysis presents the individual well Largest BF Object area (µm2) values and spheroid BF segmentation respectively.
Reproducible well-to-well kinetic measurements (average CV values of less than 10%) and highly consistent BF segmentation were noted. Inter-plate variability was evaluated in 10 distinct studies. The bar graph demonstrates the Largest BF Object area (µm2) for each of the treatment groups throughout all experiments.
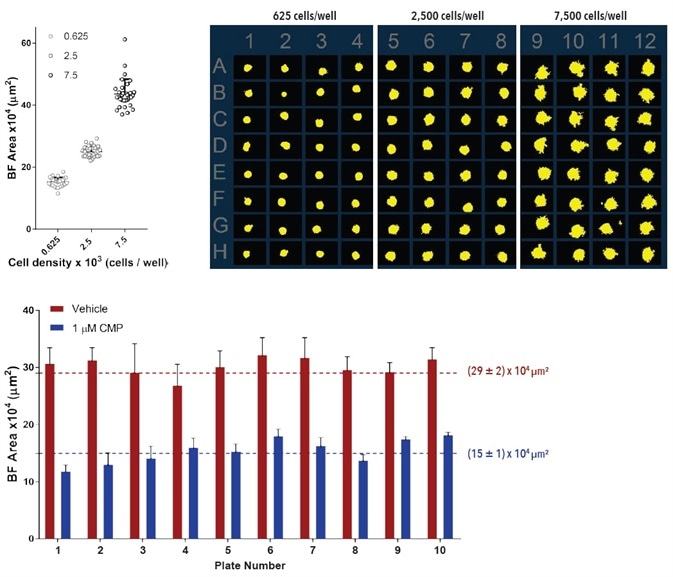
Figure 7. Precision and reproducibility of spheroid growth and shrinkage. Growth and shrinkage of A549 cells in a spheroid assay. For intra-plate reproducibility assessment, cells were plated at a density of 625, 2,500 or 7,500 cells per well and spheroids allowed to form for 72-hours. Variability plot analysis shows the largest BF area of individual wells at 180-hours post spheroid formation. Microplate overview image shows BF segmentation at 120-hours post spheroid formation. Data is expressed as mean ± SD (n=32). For inter-plate variability studies, cells were plated at a density of 2,500 cells per well, spheroid allowed to form for 72 - hours then treated with ±1 µM camptothecin. Bar graph analysis shows the Largest BF Object area (µm2) for both treatment groups. Data were collected over a 180-hour period at 6-hour intervals. All images captured at 10x magnification. Each data point represents mean ±SD, n=3-24, 10 plates. Image Credit: Sartorius
Miniaturizing to 384-well format
The spheroid shrinkage and growth assay was miniaturized to 384-well format to optimize data output. For 72 hours, HT-1080, A549, and SKOV-3 cell types at four cell densities were plated in 384-well ULA round-bottom plates.
The Incucyte® system, employing the Largest BF Object Area (µm2) metric, was used to quantify the spheroid BF area. The information shows the differential growth profile across all cell types and the cell area dependence with seeding density (Figure 8).
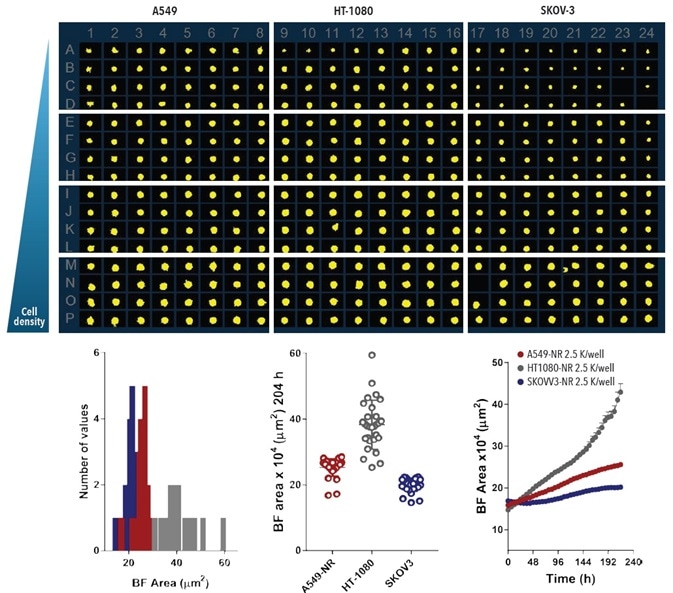
Figure 8. Miniaturizing Spheroid Growth and Shrinkage assay for assay optimization. Comparison of temporal growth profiles of A549, HT-1080 and SKOV-3 cells in a miniaturized spheroid assay. All cells seeded at a density ranging from 310 to 7,500 cells per well plated in a ULA round-bottom 384-well plate. Media was replenished 72-hours post seeding. Microplate overview image shows BF segmentation mask at 204-hours post-media replenishment. Histogram compares the distribution frequency of the BF area (µm²) across all cell types plated at 2,500 cells per well at this time-point. Variability plot analysis shows the largest BF area of individual wells at 204-hours. Time-course plots represent the differential temporal profile of the Largest BF Object Area metric (µm²) across the cell types. Data were collected over a 204-hour period at 6-hour intervals, all images captured at 10x magnification. Each data point represents mean ±SEM, n=32. Image Credit: Sartorius
Conclusions
This white paper has shown that the Incucyte® Live-Cell Analysis System facilitates the application of spheroid evaluation in real-time.
Along with phase contrast imaging, Brightfield imaging enables the label free analysis of spheroid growth, shrinkage, and morphology in 96- and 384-assay formats.
Incucyte® HD phase images provide detailed depictions of spheroid morphological characteristics (size, shape) and intercellular compaction (compact aggregates vs. loose spheroids.) notable for each type of cell.
Phase contrast images offer qualitative data while BF presents a method for objective spheroid kinetic measurement and cell dependent growth rate profile evaluation for a varied kind of spheroid.
With no requirement for a predetermined end-point selection, reproducible well-to-well kinetic data, and a highly consistent BF segmentation, the Incucyte demonstrates its suitability to the pharmacological investigation of the shrinkage and growth of spheroids.
References and further reading
- Elliot NT et al: A Review of three-Dimensional in Vitro tissue models for drug discovery and transport studies. Pharmaceutical Science 2011, 100:59-74
- Harma V et al: Quantification of Dynamic morphological drug responses in organotypic Cell cultures by automated image analysis. PLOS 2014, 9(5):e96426
Acknowledgments
Produced from materials originally authored by Susana L. Alcantara1, Miniver Oliver1, Kalpana Patel1, Tim Dale1, Del Trezise1, Nevine Holtz2, and Eric Endsley2 from:
1. Essen Bioscience, UK
2. Essen Bioscience, USA
About Sartorius

Sartorius is a leading international pharmaceutical and laboratory equipment supplier. With our innovative products and services, we are helping our customers across the entire globe to implement their complex and quality-critical biomanufacturing and laboratory processes reliably and economically.
The Group companies are united under the roof of Sartorius AG, which is listed on the Frankfurt Stock Exchange and holds the majority stake in Sartorius Stedim Biotech S.A. Quoted on the Paris Stock Exchange, this subgroup is comprised mainly of the Bioprocess Solutions Division.
Innovative Technologies Enable Medical Progress
A growing number of medications are biopharmaceuticals. These are produced using living cells in complex, lengthy and expensive procedures. The Bioprocess Solutions Division provides the essential products and technologies to accomplish this.
In fact, Sartorius has been pioneering and setting the standards for single-use products that are currently used throughout all biopharmaceutical manufacturing processes.
Making Lab Life Easier
Lab work is complex and demanding: Despite repetitive analytical routines, lab staff must perform each step in a highly concentrated and careful way for accurate results.
The Lab Products and Services Division helps lab personnel excel because its products, such as laboratory balances, pipettes and lab consumables, minimize human error, simplify workflows and reduce physical workloads
Sponsored Content Policy: News-Medical.net publishes articles and related content that may be derived from sources where we have existing commercial relationships, provided such content adds value to the core editorial ethos of News-Medical.Net which is to educate and inform site visitors interested in medical research, science, medical devices and treatments.