Sponsored Content by SartoriusReviewed by Alex SmithJun 30 2022
When conducting reproducible and interference-free analysis by liquid chromatography, the purity of the solvents used, particularly the purity of water, is crucial for the sensitivity of this method, especially for use in trace analysis.
In a recent study, various sources of ultrapure water were compared in high-performance liquid chromatography with diode-array detectors (HPLC-DAD) and mass spectrometry (MS) systems when used as eluents in a number of experiments.
Throughout the fragrance and flavor industry, numerous products are comprised of organic raw materials, such as citrus fruits, vanilla beans, blossoms and other materials that are derived from plants.
HPLC systems paired with a variety of detectors (e.g., DAD, refractive index (RI) detectors or mass spectrometers) are utilized for quality control of incoming raw materials ready for inspection as well as in the research and development of new products and the final quality control of outgoing products.
A routine analysis conducted both in research and quality control is necessary using HPLC-DAD, for example, when quantifying vanillin in various samples (e.g., vanilla extract, vanilla beans, chocolate, vanillin sugar, beverages and flavorings).
In addition to the quantification of certain analytes, screening methods for determining somewhat unknown substances found in natural products and raw extracts, among others, have a crucial role to play in terms of research.
Liquid chromatography (LC) systems are mostly used in such methods and are paired with high-resolution tiht (TOF)-MS instruments.
Dodging high background noise
Contaminants in the eluent can generate a significant baseline of noise emanating from the detector, thereby producing a poorer signal-to-noise ratio (S/N) of a peak. For example, in DAD, such contaminants are natural compounds that absorb light in the UV/VIS range.
The concentration of ions (Na+, K+ ) in LC-MS applications should be maintained at the lowest rate possible to prevent the formation of adducts with analytes throughout ionization.
Water contaminants that are refined in the stationary phase can be eluted with a greater percentage of organic solvent and emerge as possible co-eluting peaks in the chromatogram. Consequently, many individually filtered and treated types of ultrapure water are available in different grades (HPLC and LC-MS grades) on a commercial scale.
Using water purified by ultrapure water systems, such as the Arium® Mini Plus ultrapure water system, is a viable alternative to grades of water that are typically filled in 1- or 2.5-liter bottles (Figure 1).
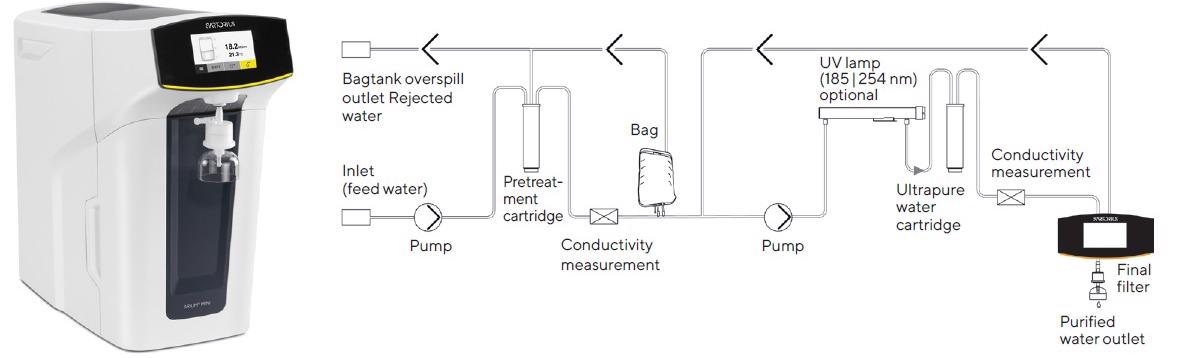
Figure 1. Arium® Mini Plus ultrapure water system and flow chart. To enhance the clarity of this diagram, the valves and process controllers have been omitted. (photo and diagram courtesy of Sartorius)
The ultrapure water freshly prepared by such a system to create an eluent for HPLC-DAD and MS systems was compared in various experiments with two commercially available bottled water brands that are LC-MS grade.
For this purpose, the background signal in the chromatogram – normally detectable as a baseline – was analyzed after a relatively long accumulation phase for each specific water sample used in the chromatographic system and successive gradient elution conducted on two different detectors (DAD- and TOF-MS).
Additionally, representative routine analyses, such as the evaluation of vanillin by HPLC-DAD and screening of a natural product by LC-MS, were performed using three different sources of ultrapure water and compared as part of the mobile phase.
Using the Arium® Mini Plus to produce ultrapure water
To produce ultrapure water, Arium® Mini Plus (Figure 1) can be connected directly to the tap water feed for a two-stage purification process. In the initial stage, this compact system creates pure water, reverse osmosis water (RO water), and in the second stage, ultrapure water.
As lower flow rates are achieved throughout RO purification, and this stage has a limiting effect on such rates, an Arium® bag is attached as a reservoir between the two stages (as displayed in the flow diagram in Figure 1).
In the first stage of the Arium® Mini Plus system, feed water passes from the system inlet into a pretreatment cartridge and into an RO module using a diaphragm pump. The RO module is comprised of two outlets, one for the concentrate flow and the other for the permeate flow.
The latter flow path and the system’s outlet are connected to drain off the water extracted from the RO purification stream, the “rejected water.” The permeate flow is purified RO water (i.e., pure water) that fills up the bag and is regulated throughout the process by a conductivity cell.
In the second downstream stage, the pure water collected is then transported by an additional pump out of the bag to the actual purification cartridge for the production of ultrapure water.
Here, pure water is converted into ultrapure water with an optional UV lamp (which has oxidizing wavelengths of 185 nm and 254 nm, respectively) and by flowing through a cartridge filled with active carbon and ion exchange resin.
Throughout purification, the quality of ultrapure water is monitored continuously by a second conductivity cell to preserve a conductivity of 0.055 µS/cm (corresponding to a resistivity of 18.2 MΩ x cm), compensated to 25 °C.
Then, in the final purification step, purified water is delivered via a final sterilizing-grade filter. This process is displayed schematically in Figure 1.
Methods and materials
The tested water sources included two certified water grades commercially available for LC-MS applications (LC-MS grade water A and B) and the ultrapure water freshly produced by the Arium® Mini Plus system.
To accurately assess the background signal in the HPLC-DAD and LC-MS chromatograms, each of the water sources was passed through an RP-C18 column, under conventional flow conditions and without the introduction of any modifiers (e.g., formic acid or buffer), for a period of 40 minutes for the HPLC-DAD method and 16 minutes for the LC-MS method, respectively.
This was done to concentrate any contaminants present in each of the water sources (accumulation phase).
Subsequently, elution of the potential contaminants was conducted by running a gradient of water used as the solvent to 100% acetonitrile. Once each run was completed, the column was reconditioned with the respective water source.
This was performed using two different systems: HPLC-DAD (system 1 supplied by Agilent based in Waldbronn, Germany) and LC-TOF-MS (system 2 supplied by Waters, Eschborn, and Bruker based in Karlsruhe, Germany). The device parameters are detailed in Table 1.
Table 1. Device Parameters of Systems 1 and 2 for Analysis of Contaminants Present in the Different Water Sources. Source: Sartorius
| |
System 1 |
System 2 |
| Device |
Agilent 1290 with DAD |
Waters Acquity UPLC,
Bruker microTOF II |
| Separation column |
Grom Sapphire C18, 150 × 2.1 mm, 5 μm (Grom analytical + HPLC, Herrenberg, Germany) |
Kinetex RP-C18, 100 × 2.1 mm, 1.7 μm (Phenomenex, Aschaffenburg, Germany) |
| Mobile phase |
A: Water B: Acetonitrile |
|
| Gradient |
0 min. 100% A | 0% B
40 min. 100% A | 0% B
50 min. 0% A | 100% B
60 min. 0% A | 100% B
70 min. 100% A | 0% B |
0 min. 100% A | 0% B
16 min. 100% A | 0% B
19 min. 5% A | 95% B
23 min. 0% A | 100% B
26 min. 100% A | 0% B
30 min. 100% A | 0% B |
| Temperature |
40 °C |
50 °C |
| Flow rate |
1 mL/min |
0.55 mL/min. |
| Detection |
200 nm |
50 – 1,600 Da (ESI- and ESI+) |
In the standard analysis, system 1 is used, for instance, to quantify vanillin, whereas system 2 is primarily used for screening compounds, such as those in natural products. For these two applications, trial runs were carried out using the different water sources.
Results
Background signal in UV and MS detection
The chromatograms of the trial runs performed using the HPLC-DAD system (system 1) are displayed in Figure 2. In the top graph (Figure 2A), the chromatograms of the three samples of ultrapure water are superimposed, and the gradient profile is marked.
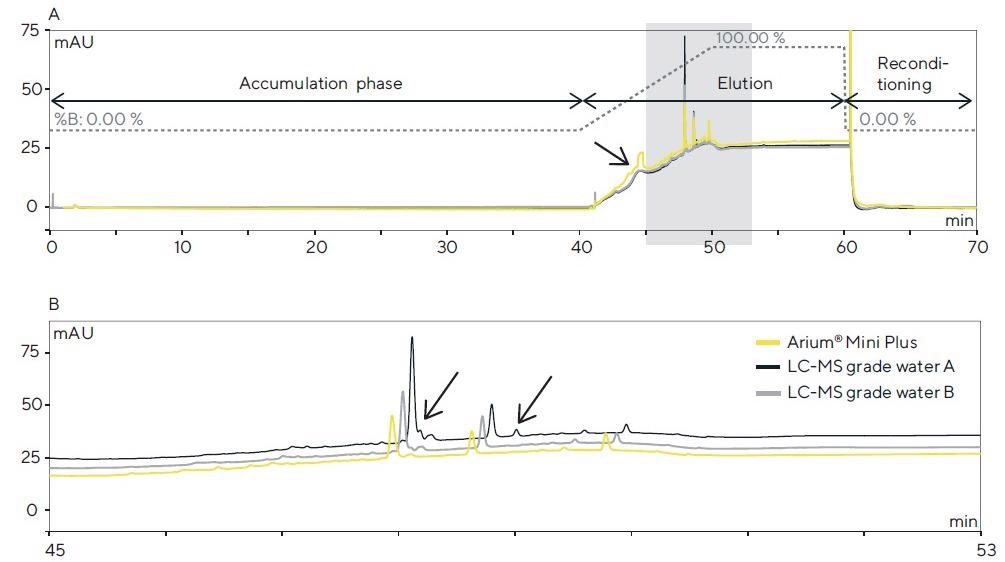
Figure 2. (A) HPLC-DAD chromatograms (detection: 200 nm) after a 40-min. accumulation phase for each of the three water sources tested in the column and subsequent elution of the contaminants performed with acetonitrile. (B) Magnified view of the colored section in A; differences in the peak profile are identified by arrows. Image Credit: Sartorius
On the chromatograms, both the bottled water grades and ultrapure water generated using the Arium® Mini Plus system demonstrate similar accumulations of contaminants in the separation column.
At around 45 minutes, a broad peak is seen, which demonstrates a significantly greater peak area for accumulation using Arium® Mini Plus water and, as a result of its asymmetry, signifies an overlay of multiple contaminants.
In the colored section (45–53 minutes; see magnified view in Figure 2B), there are minor variations in the peak profile.
Here, the profiles for Arium® Mini Plus water and water B can be compared, whereas, in water A, contaminants that are not seen in the other chromatograms are detected. This accumulation experiment produced reproducible results (n = 5).
This trial was performed to study the background signal after contaminants had accumulated in various samples of ultrapure water on an RP-C18 separation column which was conducted using a high-resolution TOF-MS system (system 2, Figure 3).
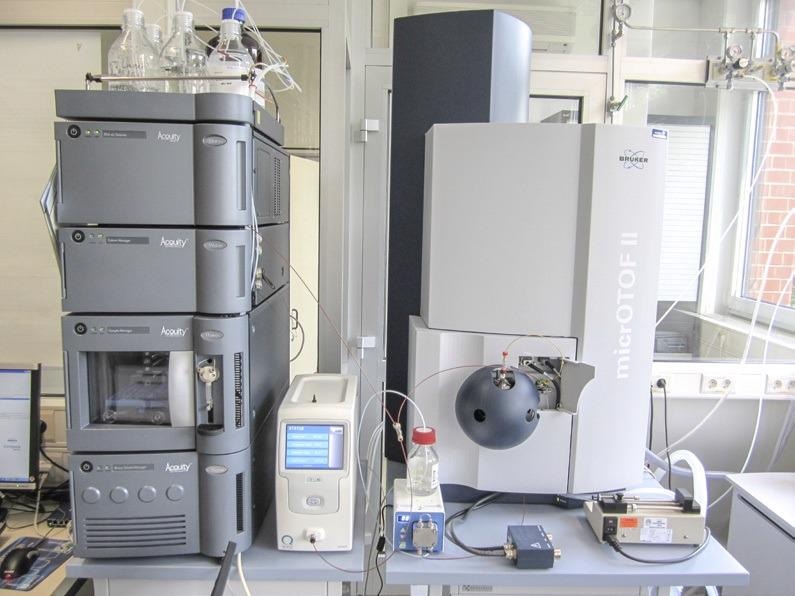
Figure 3. Waters Acquity UPLC with Bruker microTOF II (location and photo: Symrise)
After electrospray ionization in positive mode (ESI+), no major differences were seen between the peak profiles (data not shown). Conversely, differences were noticed in the peak profiles acquired in the ESI- mode (Figure 4).
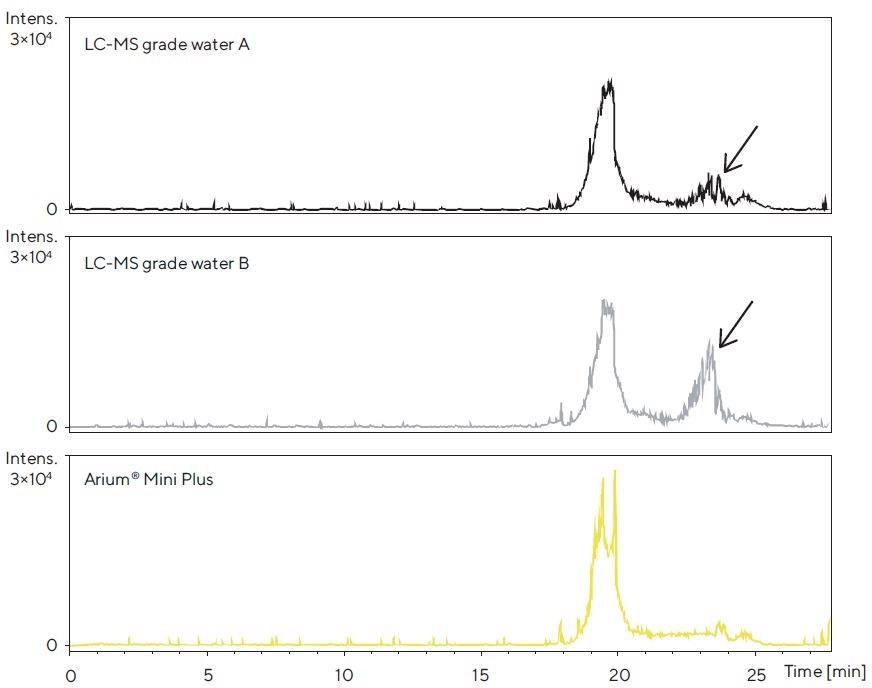
Figure 4. LC-TOF-MS chromatograms after the accumulation phase for each of the three water sources tested in the column and subsequent elution of contaminants with acetonitrile. Ionization was performed in the ESI- mode; the mass range shown is 70 – 1,600 Da. Differences in the peak profile are identified. Image Credit: Sartorius
Thus, the chromatogram for Arium® Mini Plus water, in the range of 22–25 minutes, demonstrates fewer contaminant peaks in contrast to those obtained for the brands of commercially available bottled water.
Additionally, the particular water samples were injected by a syringe pump directly into the TOF-MS system (Bruker microTOF II).
As special experiments are performed by way of direct injection, just as is the production of the reference spectra both in the scan and MS/MS modes, it is also crucial that in each of these cases, the quantity of interfering ions generated from the solvents be kept as low as possible.
The recorded spectra were averaged over a time span of 1 minute using software. Figure 5 demonstrates the examples of the spectra acquired in the ESI- mode.
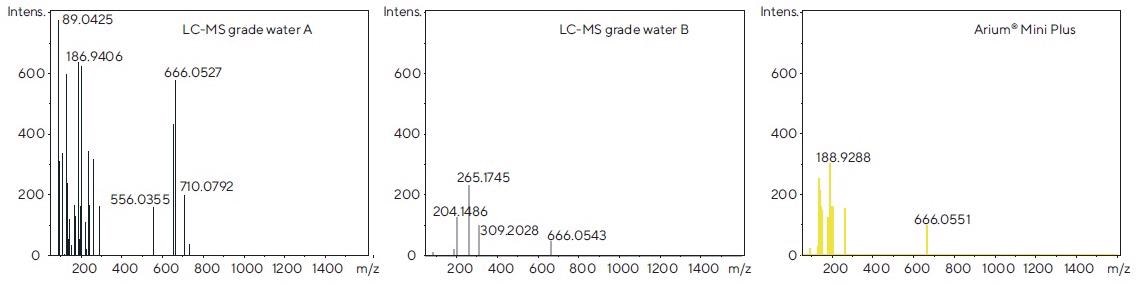
Figure 5. Mass spectra of each of the tested water sources, obtained after direct injection by syringe pump following electrospray ionization in the negative mode (ESI-). Image Credit: Sartorius
Comparatively, LC-MS grade water B and water from the Arium® Mini Plus system exhibit fewer signals of interfering ions, whereas LC-MS grade water A produces substantially more signals. This can also be seen in the ESI+ mode (data not shown) and supports the observations made when evaluating the chromatograms displayed in Figure 4.
Routine analyses: The comparison of water sources
To test and verify the usability of the various ultrapure water sources in conventional analyses, these sources were each used as solvents in sample chromatographic runs.
Quantification of vanillin in vanilla extract
After diluting with methanol (approx. 1:1,000), an analysis of vanilla extract was conducted using each of the three different water sources as an element of the respective eluents run through system 1.
In this case, the vanillin concentration of each solution injected corresponded to around 4 µg/mL. The resulting chromatograms (Figure 6A) are almost uniform, and the peak areas of vanillin do not differ at all.
However, if the vanillin concentration is inside the range of the detection limit (9 ng/mL), the background signal, as a result of the water purity, has a role to play, and significant differences can be observed (Figure 6B).
In view of the baseline curve and signal-to-noise ratio (S/N) of the vanillin peak, Arium® Mini Plus water and LC-MS grade water B are comparable, whereas the chromatogram for LC-MS grade water A demonstrates a higher baseline and greater possible number of interfering peaks.
This is an affirmation of the fact that the observations made in the experiments previously described above correspond to the background signals in the HPLC-DAD system after direct injection into the TOF-MS system.
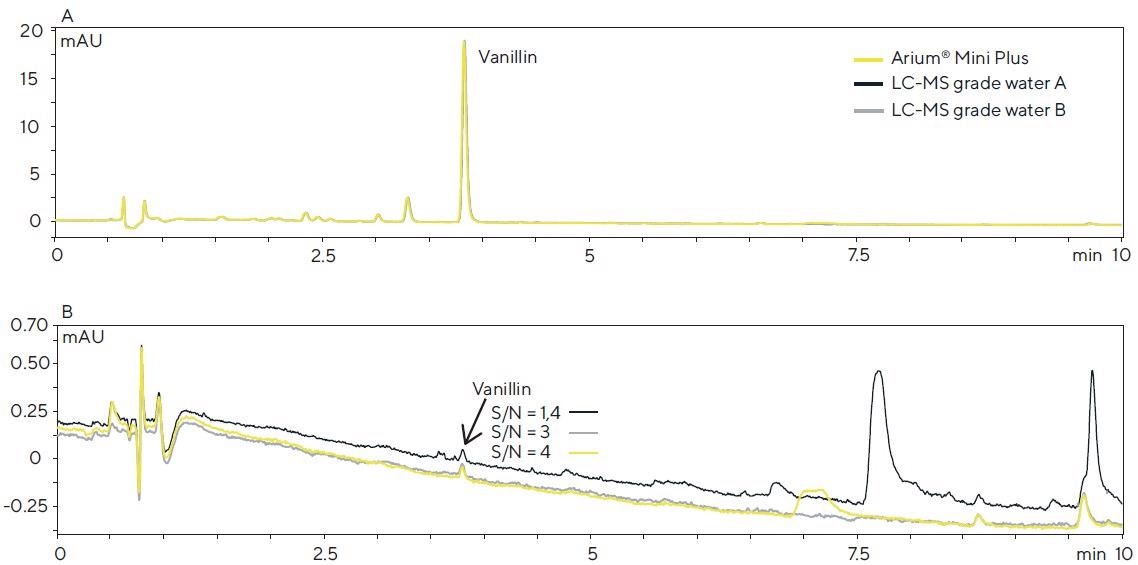
Figure 6. HPLC-DAD chromatograms of a vanilla extract (A) and an aqueous vanillin solution (B, 9 ng/mL) obtained with the different water sources used in the mobile phase (detection: 280 nm; column: Poroshell 120 SB-C18, 2.7 μm, 100 × 2.1 mm; eluents: acetonitrile and water with 0.1% formic acid in the gradient mode; flow rate: 0.4 mL/min.). Image Credit: Sartorius
Using LC-TOF-MS to screen orange oil
Three water sources were tested in a qualitative screening method using high-resolution LC-TOF-MS (system 2) to specify individual compounds in mixtures. A distinct type of orange oil was used as the primary sample material. The chromatograms are displayed in Figure 7.
Comparable performance in relation to the peak height, peak area, retention time and separation was noted. Similarly, in view of the baseline curve and signal-to-noise ratio, barely any differences were observed (see Figure 7, magnified view).
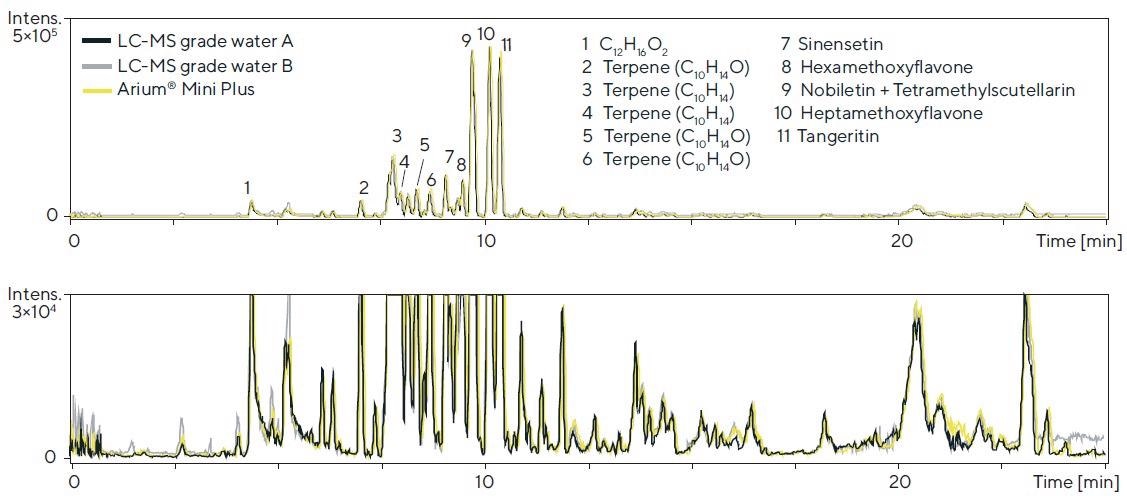
Figure 7. LC-TOF-MS chromatograms (BPC, base peak chromatogram; 70 – 1,600 Da) of an orange oil (diluted 1:20) obtained with the respective water sources in the mobile phase (detection: 50 – 1,600 Da (ESI+); column: Kinetex RP-C18, 1.7 μm, 100 × 2.1 mm; eluents: acetonitrile and water, each with 0.1% formic acid in the gradient mode; flow rate: 0.55 mL/min.; lower chromatogram: magnified view). Image Credit: Sartorius
Discussion
As seen in the experiments carried out, it could be concluded that Arium® Mini Plus ultrapure water is well-suited for use in chromatography and mass spectrometry (MS).
In light of the possible co-eluting peaks and the background signal in UV and MS detection, it was demonstrated that Arium® Mini Plus water can be compared with the tested quality grades of commercially available bottled water.
The background signal, which is mostly dependent on the purity of the solvent employed in the chromatographic analysis, must be at the lowest possible amount as this signal has a considerable bearing on the sensitivity of the analytical method and for reliable quantification.
As well as LC-MS grade water B, Arium® Mini Plus water with a greater S/N performs especially well in trace analysis that requires high sensitivity, as demonstrated in the example of the vanillin peak acquired on the HPLC-DAD chromatogram.
In contrast to commercially available branded bottled ultrapure water, an ultrapure water system delivers the greater advantage of having the capacity to purify any quantity of water as and when required. From an economic point of view, this feature is an excellent alternative to buying ultrapure bottled water.
Fresh purification also stops water from sitting in opened bottles for prolonged periods of time, which may become contaminated by absorption from the laboratory atmosphere1, 2 and dissolve CO2 from the air, among other contaminants.
Organic contaminants in water can be determined by an increase in the TOC level (total organic carbon). At high TOC levels, identifying and quantifying trace components can be compromised1 by shifts in the baseline,1,2 or by the emergence of ghost peaks.3
Additionally, if bottled water is left in storage for fairly long periods of time, Na-cations may leach from the glass bottles, which, at the same time, may lead to increased formation of adducts as ionization takes place in LC-MS systems.
Therefore, a lower yield of ions used for analysis (usually [M+H]+ or [M-H]- ) ions can have an adverse impact on the sensitivity of the method.4
The excellent suitability of fresh ultrapure water, developed by Arium® Pro systems, across different chromatography techniques (see also, e.g., 4 and 5) and the increasing use of these technologies in the most wide-ranging of applications will almost certainly add to the increasing recognition and prevalence of laboratory water purification systems.
References
- S. Mabic, C. Regnault and J. Krol, “The Misunderstood Laboratory Solvent: Reagent Water for HPLC”, LCGC Europe, 18 (7), 410-414, 2005.
- M. Tarun and S. Mabic, “A practical guide to the effects of water purity on HPLC, LC-MS and related techniques,” 2011, Millipore Corporation.
- W. Gottwald, “RP-HPLC für Anwender,” publisher Gruber, U. and Klein, W., VHC Weinheim, 1993.
- T. Iven, K. Feußner, C. Herrfurth and E. Herbig, “Signalstoffe der pflanzlichen Abwehr - HPLC-MS/ MS-Analyse von Jasmonaten”, LABO, 2014, 12, 44-47.
- K. Töppner, D. Hansen, and E. Herbig, “Reinstwasser für die HPLC”, LABO, 2013, 6, 22-27
About Sartorius

Sartorius is a leading international pharmaceutical and laboratory equipment supplier. With our innovative products and services, we are helping our customers across the entire globe to implement their complex and quality-critical biomanufacturing and laboratory processes reliably and economically.
The Group companies are united under the roof of Sartorius AG, which is listed on the Frankfurt Stock Exchange and holds the majority stake in Sartorius Stedim Biotech S.A. Quoted on the Paris Stock Exchange, this subgroup is comprised mainly of the Bioprocess Solutions Division.
Innovative technologies enable medical progress
A growing number of medications are biopharmaceuticals. These are produced using living cells in complex, lengthy and expensive procedures. The Bioprocess Solutions Division provides the essential products and technologies to accomplish this.
In fact, Sartorius has been pioneering and setting the standards for single-use products that are currently used throughout all biopharmaceutical manufacturing processes.
Making lab life easier
Lab work is complex and demanding: Despite repetitive analytical routines, lab staff must perform each step in a highly concentrated and careful way for accurate results.
The Lab Products and Services Division helps lab personnel excel because its products, such as laboratory balances, pipettes and lab consumables, minimize human error, simplify workflows and reduce physical workloads.
Sponsored Content Policy: News-Medical.net publishes articles and related content that may be derived from sources where we have existing commercial relationships, provided such content adds value to the core editorial ethos of News-Medical.Net which is to educate and inform site visitors interested in medical research, science, medical devices and treatments.