Monoclonal antibodies are commonly utilized as anti-inflammatory, anti-cancer and anti-viral therapeutic agents. The location, extent and rate of internalization into cells are considered to be important antibody properties.
Antibody-drug conjugates (ADCs) distribute cytotoxic payloads to cells with the degree and specificity of cellular uptake being crucial to the molecule’s effectiveness and safety.
Additionally, monoclonal antibodies are utilized within immunotherapy to flag tumor cells for immune cell clearance (e.g. ADCC, ADCP (1, 2, 3)), as well as for driving the internalization of receptors linked to tumor survival (e.g. EGFR (4, 5)).
In either case, the rate of removal from the cell surface will impact upon the therapeutic profile of the antibody considerably.
Internalization of antibodies by specific (target mediated) or non-specific (e.g. pinocytosis in endothelial cells) mechanisms forms a key determinant of the half-life in the body, and even subtle changes to the structure of monoclonal antibodies can result in considerable changes to the duration of activity.
It is for these reasons that it is essential to gain a clear comprehension of the internalization of antibodies into cells. It is equally important to be able to compare the uptake of different antibodies in antibody selection, as this allows for these to be optimized for biologics drug discovery.
The methods used to directly quantify antibody internalization are currently painstaking, time-consuming and not suitable for testing several antibodies at once. These assays usually require labeling each antibody with a fluorescent tag, and in nearly all of these cases the labeled antibody must then be split from the free label via a wash step or column.
Proper analysis involves the signal from the internalized antibody being sufficiently isolated from that outside the cells. Blocking dyes, wash steps and/or lowering temperature to slow cellular activity are often used to ensure this.
Virtually all these approaches (e.g. flow cytometry, high content imaging) offer only end point assays, so numerous experiments are needed to track internalization over time.
This white paper outlines an approach developed to address these limitations: an integrated assay solution that is based on Incucyte® Live-Cell Analysis, along with a novel pH-sensitive dye coupled antibody fragment (Incucyte® FabFluor Antibody Labeling Reagents).
This innovative solution provides an easy, turnkey means of evaluating the internalization of significant numbers of antibodies. It is suitable for basic scientific research as well as for use across the industrial antibody drug discovery process.
Assay principle
Incucyte® FabFluor Antibody Labeling Reagents are Fc-region targeting Fab fragments that are conjugated to a pH-sensitive fluorescent probe. These reagents allow a generic single-step, no-wash, labeling protocol for the whole range of isotype matched, Fc-containing test antibodies.
At pH 7.0, the Fab-Ab complex has limited, or even no visible fluorescence. However, when labeled antibodies are added to cells, a fluorogenic signal can be seen as the Fab-Ab complex is internalized and then processed via acidic (pH 4.5-5.5) endosomes and lysosomes (Figure 1).
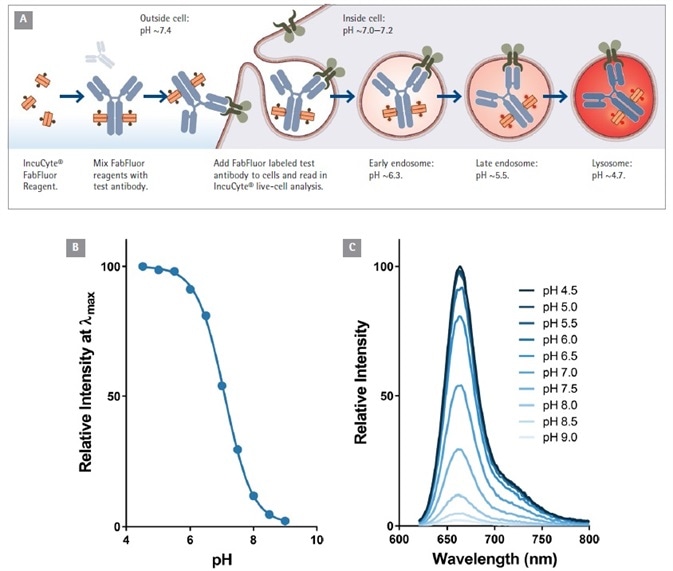
Figure 1. Principle of antibody Internalization assay using Incucyte® FabFluor labeling reagent. (A). Fluorogenic signal as internalized antibody is processed into the acidic endosome and lysosome. Data to show the pH sensitivity of the labeling probe (B and C). Note the relatively low fluorescence of FabFluor at pH 7.0. Image Credit: Sartorius
The complete course of internalization is automatically quantified and visualized using Incucyte® real-time live cell analysis. Both the labeling method and assay workflow are ideal for assessing internalization rates of many antibodies (10-100s) in miniaturized (96/384 well) plate formats.
Quick guide
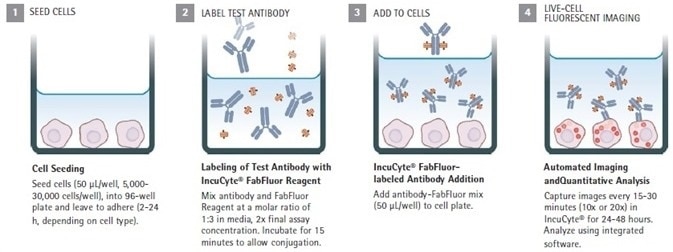
Image Credit: Sartorius
General methods and materials
Cell culture and reagents
The following were grown in 75 cm2 tissue culture treated flasks: BT-474 cells (DMEM+10% FCS), HT1080 cells (F12K+10% FCS, 1% glutamax, 1 u/mL pen/strep), Jurkat and Raji cells (both RPMI 1640+10% FCS).
Every cell line was supplied by ATCC with culture reagents sourced from Life Technologies. Commercially available test antibodies included CD71 clone 1a, 2, CD20 (Sigma), clone 3-5 (Abcam), CD3, CD45 (Biolegend), human IgG isotype control (Absolute Antibody), mouse IgG1 isotype control (R&D Systems).
Antibody labeling
A known concentration of test antibody was mixed with isotype matched, Incucyte® FabFluor reagent in complete growth media, using a molar ratio of 1 to 3.
Reactions were executed at double the final required assay concentration and incubated for 15 minutes at 37 °C. These used either an amber microtube or a round bottom 96-well plate (Costar #3799) depending on the volumes required.
Where dilutions were required (e.g. for creating concentration response-curves), these were performed after conjugation to maintain the labeling ratio. Next, FabFluor labeled antibody (50 μL) was added to pre-plated cells (in 50 μL) directly.
Incucyte® antibody internalization experiments
Cells were plated (BT-474 10K per well, 16 hours, HT1080 8K per well, 4 hours) on flat-bottom 96-well plates (Costar #3595) before assay.
Where assays used non-adherent cell types, plates were coated with poly-L-ornithine (PLO, Sigma P4957) for 1 hour, followed by 30 minutes drying time before cell seeding took place.
Cells were seeded at 30 K/well, for 1 hour before assay. Once Ab/Fab had been added, complex assay plates were placed inside of an Incucyte® S3 live-cell analysis system before being scanned for red fluorescence and HD phase images. This was done at 10x or 20x magnification every 15 to 30 minutes for up to 48 hours.
Images were analyzed using the integrated, automated Incucyte® software for the following metrics phase confluence (measure of cell area) and red fluorescence object area (index FabFluor labeled internalized antibody). Top Hat subtraction was employed in order to reduce any background fluorescence signal.
Validation data
Proof of concept
Internalization of an antibody to CD71 - the transferring receptor - was measured in HT1080 fibrosarcoma cells. The anti-CD71 antibody (clone MEM189) and a mouse IgG1 isotype control were then labeled with isotype matched Incucyte® FabFluor Red Mouse IgG1 Labeling Reagent.
FabFluor labeled antibodies (4 μg/mL) were added to cells and an Incucyte® S3 Live-Cell Analysis system was used to observe red fluorescence and phase contrast for 12 hours.
A fast, time-dependent rise in red fluorescence was noted with anti-CD71, but not isotype or media control. This occured from the first time point (15 minutes) of the assay (Figure 2).
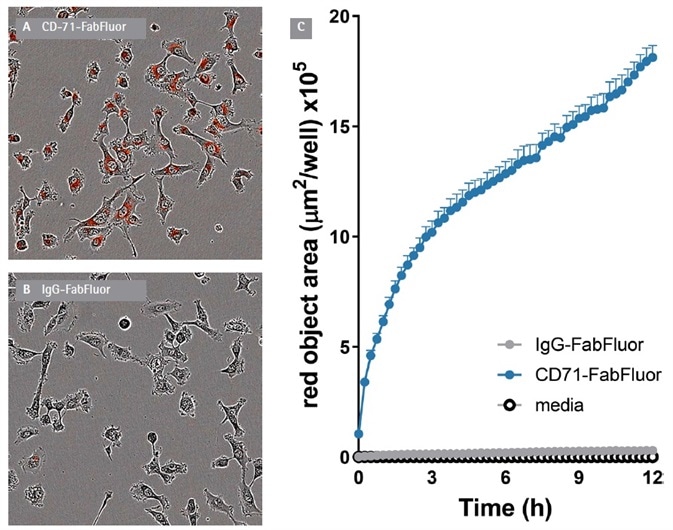
Figure 2. Internalization of Incucyte® FabFluor labeled α-CD71 in HT1080 cells. T1080 cells were treated with either Incucyte® FabFluor labeled α-CD71 or IgG1 isotype control (4 μg/mL), HD phase and red fluorescence images (10x) were captured every 15 min over 12 h. Images of cells treated with FabFluor-α-CD71 display red, cytosolic fluorescence (A). Cells treated with labeled isotype control display no cellular fluorescence (B). Time course data shows a rapid increase in red object area over time in cells treated with labeled α-CD71 but not with isotype control (C). Images shown taken at 6 h post treatment, data shown as mean of 3 wells ± SEM. Image Credit: Sartorius
At 12 hours, the signal:background of the assay was >15 fold. The red signal was noted in the cytosolic compartment of the cells but was not seen in the nucleus. This was in line with the anticipated localization of the internalized antibody to lysosomes and endosomes. Fluorescence area (µm2/well) was utilized to quantify the specific signal.
Normalization for cell number
Theoretically, the antibody internalization signal ought to rise as a function of cell number. To confirm this, and to better comprehend the contribution of cell proliferation to the signal over time, experiments were performed on cells plated at various densities (1-20 K per well).
Anti-CD71 internalization (red fluorescence area) was detectable at 1 K cells per well and notably raised at greater plating densities (Figure 3 A and B). Over time (0-12 hours) the internalization signal continued to increase.
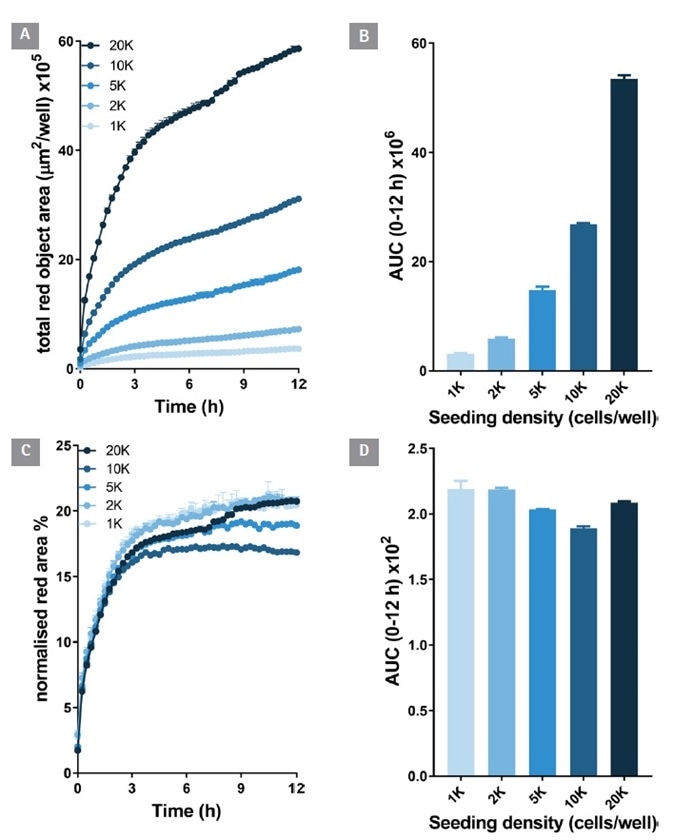
Figure 3. Antibody internalization response is cell number dependent. An increasing density of HT1080 cells were seeded (1-20 K/well) and treated with Incucyte® FabFluor labeled α-CD71 (4 μg/mL). HD phase and red fluorescence images (10x) were captured every 30 min over 12 h. The time-course of red object area data demonstrates an increasing internalization signal with increasing cell number (A and B). When the red object signal is normalized for phase area it is clear the internalization response size is dependent on cell number (C and D). All data shown as a mean of 3 wells ± SEM, bar graphs show area under the curve (AUC) calculated from time course data. Image Credit: Sartorius
When the red fluorescence area was normalized to the total cell area (phase confluence) to take into account proliferation, the time course signals were very similar.
It is important to note that after 4 hours there was no more increase in the normalized signal. This indicates that antibody internalization had reached equilibrium. This approach to normalization allowed the impact of well to well cell seeding variation to be minimized, and for the isolation of the true internalization rate signal from cell proliferation.
Signal co-localization with lysosomal marker
In order to verify the presence of the internalized antibody within the lysosome, dual labeling experiments were performed with an end-point lysosomal marker, the LysoSensor® Green (Thermo Scientific).
HT1080 cells were treated with FabFluor-labeled-CD71 for 3 hours and observed for antibody internalization. LysoSensor Green was added before the plate was re-inserted into the Incucyte® to measure green (LysoSensor) and red (CD71) fluorescence.
A robust co-incident signal was detected in the two signal channels. 74% of the red signal was co-localized with green, reinforcing the assertion that the Fab-Fluor labeled antibody had been internalized to the lysosome.
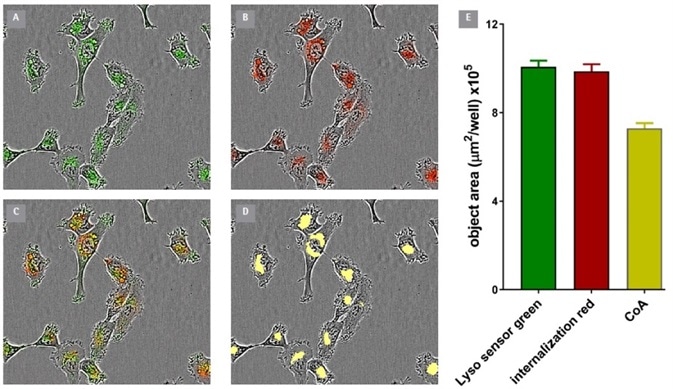
Figure 4. Co-Localization of Incucyte® FabFluor labeled α-CD71 and Lyso Sensor® Green in HT1080 cells. Internalization of Incucyte® FabFluor labeled α-CD71 (4 μg/mL) was established for 3 h in HT1080 cells before addition of LysoSensor® Green DND-189 (Thermo, 0.25 μM). Images show individual LysoSensor® Green and FabFluor labeled α-CD71 red signal (A and B), co-localization of red and green signals (C), and the co-localized analysis mask shown in yellow (D). (E) Incucyte® analysis of the coincidence of the red and green fluorescence confirms co-localization of 74% of the red signal with the green signal. Images captured at 20x magnification, 30 min post LysoSensor® addition, data shown as mean of 4 wells ± SEM. Image Credit: Sartorius
Applicability across different cell types and antibodies
In order to highlight the wide ranges of applications and the specificity of the method in question, internalization was evaluated for a range of test antibodies which were targeted against specific CD markers, expressed in various cell lines (Figure 5).
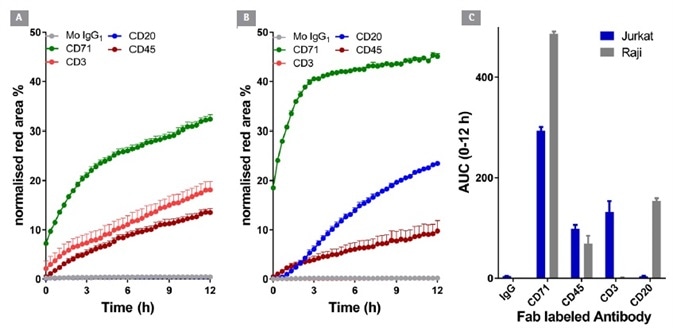
Figure 5. Internalization of CD surface marker targeted antibodies in lymphocytic cell lines. Jurkat (T cell-like) and Raji (B cell-like) cells (30 K/well) were treated with different Incucyte® FabFluor labeled antibodies (4 μg/mL). HD phase and red Images were captured every 30 minutes using a 20x objective over 12 h. Time course data (A and B) and area under the curve (AUC, C) analysis demonstrates the response profile in both cell lines. All data shown as a mean of at least 4 wells ± SEM, time course data shown as normalized red area. Image Credit: Sartorius
Anti-CD20 was internalized in the B-cell line Raji, but not in the T-cell line Jurkat. On the contrary, anti-CD3 was internalized in Jurkat but not Raji. Antibodies to CD71 and CD45 - general lymphocyte markers – were noted to be internalized in both cell types. Significantly, IgG was not internalized in either cell type.
These results are comparable with the known CD surface marker expression of these cell lines, offering good confirmation of the generic utility and signal specificity of this method.
Quantitative pharmacological analysis
Pharmacological, kinetic quantification of antibody internalization
In order to highlight the quantitative nature of this method and its appropriateness for the analysis of therapeutic antibodies, this process aimed to establish EC50 values for the internalization of two monoclonal antibodies used clinically: Herceptin (Trastuzumab) and Rituxan (Rituximab).
Each antibody was labeled with the FabFluor reagent before being serially diluted (1:2) and then added to cells. This allowed for the construction of a concentration-response curve.
Approaching the management of the labeled antibody in this fashion proved good practice, allowing for the elimination of any discrepancies in Fab labeling efficiency across the concentration range.
In BT-474 Her2-positive breast carcinoma cells, notable time and concentration dependent internalization of Herceptin was seen over a 48 hour period.
From an area under the time-course (AUC) analysis, the EC50 value for internalization was 323 ng/mL ≡ 2.1 nM, Figure 6). Within Raji cells, the EC50 value for Rituxan was 426 ng/mL ≡ 2.6 nM, Figure 7). These EC50 values display similarities with the known KD values for Herceptin and Rituxan for their target receptors (both approximately 5 nM).
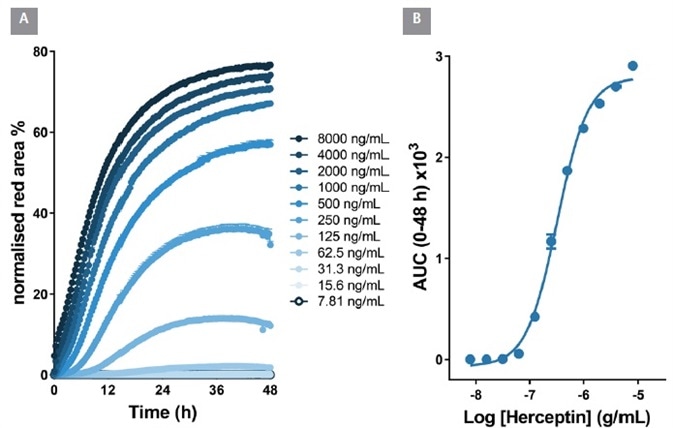
Figure 6. Quantitative pharmacological analysis of IncuCyte® FabFluor labeled Herceptin. BT-474 Her2-positive cells were treated with increasing concentrations of FabFluor labeled Herceptin. The time course graph displays an increase normalized red area over time with increasing Herceptin concentrations (A). Area under the curve analysis of this response displays a clear concentration dependent response with an EC50 of 323 ng/mL (B). All data shown as a mean of 3 wells ± SEM, time course data shown as normalized red area. Image Credit: Sartorius
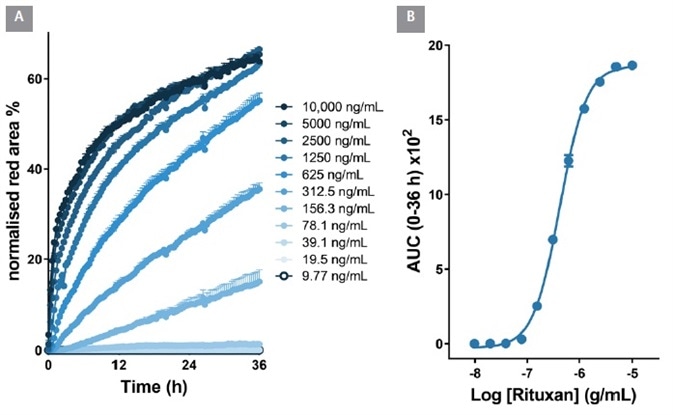
Figure 7. Quantitative pharmacological analysis of Incucyte® FabFluor labeled Rituxan. Raji cells were treated with increasing concentrations of FabFluor labeled Rituxan. The time course graph displays an increase normalized red area over time with increasing Rituxan concentrations (A). Area under the curve analysis of this response displays a clear concentration dependent response with an EC50 of 426 ng/mL (B). All data shown as a mean of 3 wells SEM, time course data shown as normalized red area. Image Credit: Sartorius
Comparison of multiple test antibodies for high-throughput screening
The features of the Incucyte® and FabFluor solution mean that it should be relatively simple to label many antibodies in parallel before comparing their internalization. In order to test this hypothethsis, 6 commercially available anti-CD71 antibodies – all different - were compared, in order to examine their internalization properties alongside one another.
All of the antibodies were plated in 96-well plates before being labeled in full media with the Incucyte® FabFluor labeling reagent. Serial dilutions were done in full media (8 point, 1:2). Only Labeled IgG and FabFluor were added to control wells.
Labeled antibodies were then added to pre-plated HT1080 cells and observed for internalization over a 12 hour period.
Of the 6 antibodies, 3 (Ab 1a, Ab2 and Ab 1b) yielded large internalization signals and were found at low concentrations (<0.05 µg ml-1). Encouragingly, Ab 1a and Ab 1b were the same antibody clone from different suppliers, and provided comparable internalization responses.
Abs 3, 4, and 5 were internalized less, and only at higher concentrations (Figure 8). A mean Z’ value of 0.82 was determined (2 plates 0.75, 0.87) from the control responses, indicating a robust microplate assay.
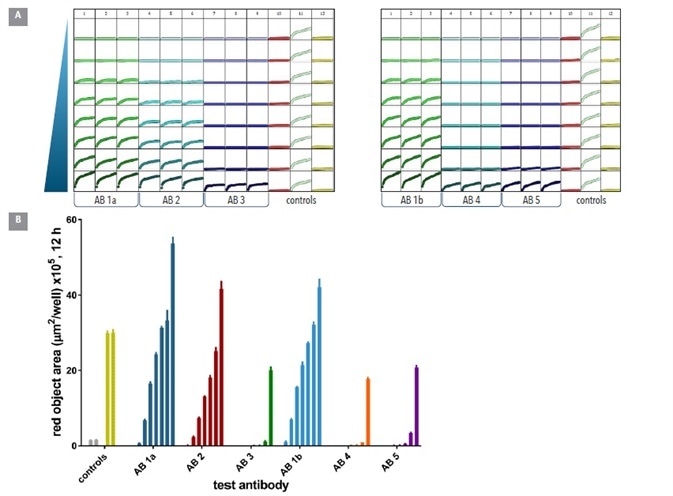
Figure 8. Screening test Abs for internalization. Six different CD71 antibodies including one clone from 2 different suppliers (clone 1a & 1b) were tested head to head in HT1080 cells. The antibodies were labeled with Incucyte® FabFluor reagent prior to addition to cells and the internalization signal captured every 30 min over 12 h using a 10x magnification. Plate views taken from Incucyte® show clear positive and negative control responses in column 11 and 12 with concentration dependent responses for each antibody across two plates (A). Head to head analysis of antibody data shows a range of responses across these clones (B) control responses at 12 h display a clear positive response. All data shown as mean of 3 wells ± SEM, controls shown as mean of 8 wells. Image Credit: Sartorius
As can be seen above, these results prove the appropriateness of this method for the comparison of multiple antibodies’ internalization at a single target, and demonstrate that the internalization profile is a property of the antibody itself.
The assay precision and work flows mean that 100s of different antibodies could be compared at once, with even more throughput possible through miniaturization to 384-well format.
Conclusions
The approach described above has a number of key features. These are outlined below.
The examples above used a 1 step labeling protocol. This allowed for straightforward tagging of antibodies of interest with an Fc-targeted Fab coupled pH-sensitive dye (Incucyte® FabFluor). The labeling method was undertaken in full media and is appropriate for both antibody supernatants and purified antibodies.
Additionally, an automated, image-based and real time analysis method (Incucyte®) was used for monitoring internalization in several 96-well microplates simultaneously. This format is well suited to both adherent and non-adherent cells.
Finally, the examples above utilized an assay system which followed the full time course of the biology, reporting internalization with high sensitivity, specificity and morphological information.
Using a pH-sensitive dye allowed for low background signal and removes any need to separate out fluorescence arising from antibody on the cell surface, or occurring in bulk solution.
When used together, these key features offer a straightforward, integrated and quantitative solution for efficiently studying internalization of antibodies. This can easily be scaled to compare many antibodies (10-100s) in parallel.
A central feature of this method is that it allows antibody internalization measurements to be applied at earlier stages in the biologics discovery process. Not only will this prove vital in efficacy and safety, but it is also extremely useful in the pharmacokinetic optimization of novel therapeutic antibodies.
Not only that, but this method is also well suited to exploring and comprehending the basic mechanisms of pinocytosis, endocytosis and receptor turnover where antibodies can be utilized.
References
- Carmen M et al: Antibody-dependent cell cytotoxicity: immunotherapy strategies enhancing effector NK cells. Immunology and Cell Biology 2017, 95:347-355.
- Weiskopf K and Wiessman I: Macrophages are critical effectors of antibody therapies for cancer. mABs 2017, 7:303-310.
- Beck A et al: Strategies and challenges for the next generation of antibody-drug conjugates. Nature Reviews Drug Discovery 2017, 16:315-337.
- Tomas A et al: EGF receptor trafficking: consequences for signaling and cancer. Trends in Cell Biology 2014, 24:26-34.
- Harding J and Burtness B: Cetuximab: An epidermal growth factor receptor chimeric human-murine monoclonal antibody. Drugs Today 2005, 41:107-127.
Acknowledgments
- Produced from materials originally authored by Nicola Bevan, Tim Dale and Del Trezise from Essen BioScience.
About Sartorius

Sartorius is a leading international pharmaceutical and laboratory equipment supplier. With our innovative products and services, we are helping our customers across the entire globe to implement their complex and quality-critical biomanufacturing and laboratory processes reliably and economically.
The Group companies are united under the roof of Sartorius AG, which is listed on the Frankfurt Stock Exchange and holds the majority stake in Sartorius Stedim Biotech S.A. Quoted on the Paris Stock Exchange, this subgroup is comprised mainly of the Bioprocess Solutions Division.
Innovative technologies enable medical progress
A growing number of medications are biopharmaceuticals. These are produced using living cells in complex, lengthy and expensive procedures. The Bioprocess Solutions Division provides the essential products and technologies to accomplish this.
In fact, Sartorius has been pioneering and setting the standards for single-use products that are currently used throughout all biopharmaceutical manufacturing processes.
Making lab life easier
Lab work is complex and demanding: Despite repetitive analytical routines, lab staff must perform each step in a highly concentrated and careful way for accurate results.
The Lab Products and Services Division helps lab personnel excel because its products, such as laboratory balances, pipettes and lab consumables, minimize human error, simplify workflows and reduce physical workloads
Sponsored Content Policy: News-Medical.net publishes articles and related content that may be derived from sources where we have existing commercial relationships, provided such content adds value to the core editorial ethos of News-Medical.Net which is to educate and inform site visitors interested in medical research, science, medical devices and treatments.