Sponsored Content by SartoriusReviewed by Alex SmithMar 30 2023
Cell migration is a multistep process fundamental to essential physiological processes, including embryonic development and immune cell migration, in addition to pathological conditions, such as tumor metastasis.
Cell migration is activated by environmental stimuli causing the rearrangement of microtubules and actin filaments at the leading edge.1 Through the formation of tight integrin-based focal adhesions, the leading edge directs the cell across the substrate.2
The cycle ends with membrane retraction at the lagging cell edge, and the cycle is subsequently repeated in rapid succession. The summation of these processes generates the kinetic changes linked to cell migration.
One of the main characteristics of cancer is tumor metastasis, which is intrinsically connected to the dysregulation of pathways involved in cell migration.
Metastasis is the growth of a secondary tumor site as a result of malignant cells detaching from their basement membrane and migrating to a new site via the lymphatic or vascular circulatory systems.3
Cell migration, together with other processes such as cell invasion, contributes to both the formation and survival of tumors. Developing an understanding of these processes is critical to controlling tumor progression and survival in future therapies.
Typical approaches to researching cell migration, such as the creation of a wound with a narrow object, can be inconsistent, time-consuming, and heavily reliant on end-point analyses. Live-cell analysis techniques have been developed that offer a solution to measure cell migration in real-time in a robust manner.
Assay principle
This article discusses the value of the Incucyte® Scratch Wound Cell Migration Assay, which uses the Incucyte® Live-Cell Analysis System together with the Incucyte® Scratch Wound Analysis Software Module for automated image-based measurements of in vitro cell migration.
This flexible assay may be accurately carried out over a range of cell lines and compounds. The visualization and quantification of cell migration kinetics in a 96-well format are outlined below.
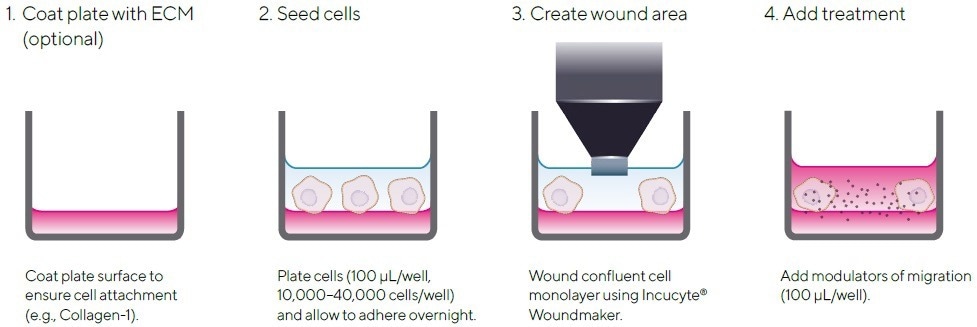
Figure 1. Quick Guide of Incucyte® Scratch Wound Assay Protocol. The simple protocol utilizes the Incucyte® Woundmaker and the Incucyte® Live-Cell Analysis System for image-based measurements of cell migration in real time. Image Credit: Sartorius
- Wells either have a layer of biomatrix applied to guarantee the tight adherence of cells to the well or are left uncoated.
- Cells of interest are seeded into an Incucyte® Imagelock Plate and incubated overnight at 37 °C with 5% carbon dioxide.
- Optional: To guarantee true detection of migration, cells, once confluent, may be pre-treated with an antiproliferative agent such as mitomycin C (MMC). The pre-incubation time and concentration are required to be optimized for each cell type.
- Confluent cell monolayer is wounded utilizing the Incucyte® 96-Well Woundmaker Tool.
- Following washing, media-containing treatments are added (100 µL/well at 1X final assay concentration (FAC)).
Materials and methods
The Incucyte® Scratch Wound Assay involves a straightforward procedure that uses the Incucyte® 96-Well Woundmaker Tool to concurrently produce precise and uniform wounds in cell monolayers that are cultured on Incucyte® Imagelock 96-well Plates (see Figure 1).
The utilization of Incucyte® Imagelock Plates means that the wounds are automatically located and registered by integrated Incucyte® software.
Quantification of cell migration
The Incucyte® Scratch Wound Analysis Software Module delivers automated quantification of cell migration using label-free or dual fluorescence readouts in real-time.
Two proteins were studied within the PI3K-Akt pathway — phosphoinositide-3-kinase (PI3K) and phosphatase and tensin homolog (PTEN) —both of which regulate cell migration.4
To examine their effects, HeLa wild-type (WT) cells and two HeLa knockout cell lines of either PTEN (abcam, ab255419) or PI3K (abcam, ab257029) were utilized.
Figure 2 displays phase images of HeLa WT cells over a period of 24 hours, with segmentation masks representing the original scratch (blue) and wound closure over time (yellow) (seen in Figure 2A).
Cell migration may be measured using the Relative Wound Density (RWD) metric. Calculations are made by comparing the cell density inside the wound to the cell density outside the wound.
The data obtained identified that the knockout cell lines have a delayed migration rate, with 38% for PTEN knockout, 40% for PI3K knockout, and 60% for WT at 48 hours (see Figure 2B). It is noteworthy that full wound closure did not occur across all cell lines.
This data emphasizes how this assay confirms cell line comparison and the assessment of proteins involved in migration signaling pathways.
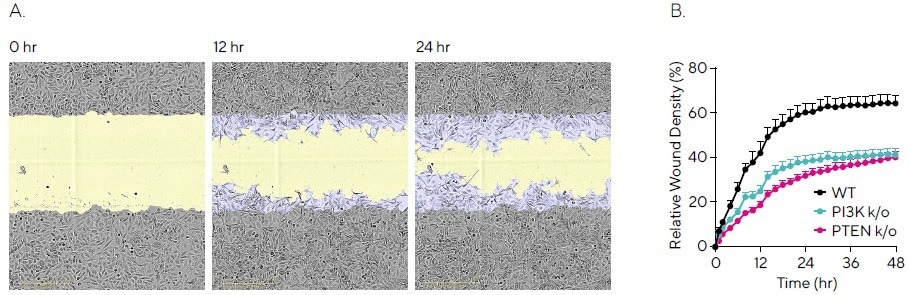
Figure 2. Quantifying Migration Profiles of HeLa WT and Knockout Cell Lines. HeLa WT, HeLa PI3K knockout and HeLa PTEN knockout cell lines were seeded into an Incucyte® Imagelock Plate (30,000 cells/well) and allowed to adhere overnight. Precise, reproducible wounds were created using the Incucyte® Woundmaker Tool and phase-contrast images were acquired every 2 hours using the Incucyte® Live-Cell Analysis System. (A) Time-lapse phase images shown migration for HeLa WT cells over 24 hours, with segmentation masks shown for initial scratch (blue) and wound closure over time (yellow). (B) Kinetic quantification revealed differential migration rates for WT vs knockout cells, which plateaued by 48 hours for all cell lines. Data shown as mean ± SEM, n = 12 replicates. Image Credit: Sartorius
Optimization of migration assay conditions
When performing cell migration assays, it should be considered that proliferation may partly drive wound closure. Mitomycin C (MMC) is an antiproliferative compound frequently utilized for controlling proliferation in scratch wound assays.5-7
To research this, BxPC3 and MDA-MB-231 cells were wounded following incubation with 50 µM MMC, and phase images were obtained (displayed in Figure 3A). BxPC3 demonstrated a slower migration rate compared to MDA-MB-231 cells, with an RWD of 95.3% compared to 66.9% for vehicle, respectively, by 24 hours (see Figure 3B).
No impact on the migration rate was observed for MMC in MDA-MB-231 cells, suggesting that wound closure is mainly driven by migration. The slower migratory BxPC3 cells have a larger window for proliferation.
MMC pre-incubation reduced migration compared to vehicle, indicating that proliferation contributes to the closure of wounds in this cell line. This emphasizes how antiproliferative compounds can enable results for certain cell types to be standardized.
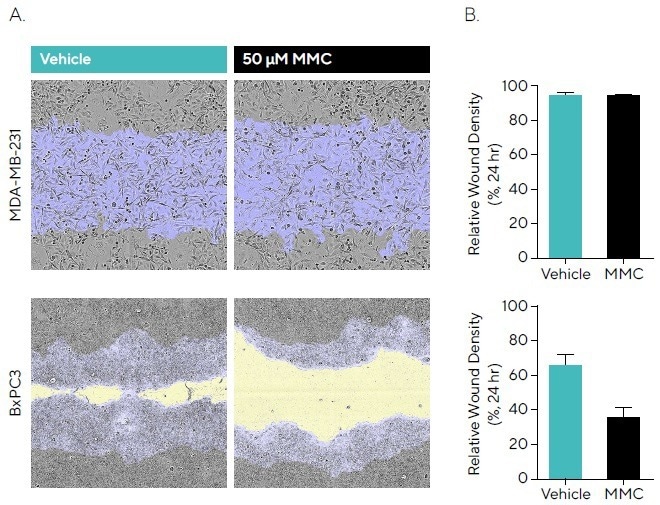
Figure 3. Anti-Proliferative Effects of Mitomycin C (MMC) During Cell Migration. MDA-MB-231 and BxPC3 cells were seeded (30,000 cells/well and 50,000 cells/well, respectively) and, once a monolayer had formed, pre-treated with 50 μM MMC for 4 hours. Cells were wounded, washed and migration was monitored using the Incucyte® Live-Cell Analysis System. (A) Phase images at 24 hours show reduced wound closure in the presence of MMC in BxPC3 but not MDAMB-231 cells compared to vehicle. Segmentation masks shown for initial wound mask (blue) and wound closure over time (yellow). (B) Bar graphs indicate that for MMC, BxPC3 showed attenuated migration compared to vehicle, while MDA-MB-231 cells showed no reduction indicating wound closure is driven by migration. Data shown as mean ± SEM, n = 6–8 replicates. Image Credit: Sartorius
Fetal bovine serum (FBS) is a universal element of cell culture media and contains factors that are critical for cell attachment, growth, and proliferation.8 T98G cell migration when exposed to FBS (0-10%) was studied (see Figure 4).
Without the serum present (0% FBS), after 24 hours, cells showed an RWD of 63.6%. However, there was a correlation between an increase in the percentage of serum and an increase in migration rate, up to a maximal RWD of 92.6% in 10% FBS (see Figure 4A).
The images demonstrate changes in cell morphology, with an extensive, elongated phenotype observed for 0% when compared with 10% FBS (see Figure 4B).
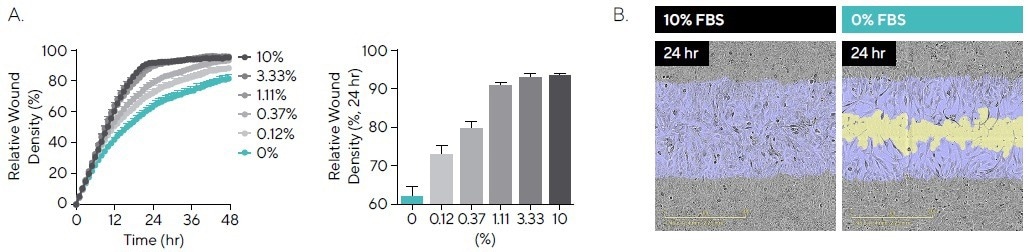
Figure 4. Cell Migration in the Presence of Serum. T98G glioblastoma cells were seeded onto PDL pre-coated Incucyte® Imagelock Plates (30,000 cells/well) and wounded after 24 hours. Media was added containing fetal bovine serum (FBS; 0–10%). (A) Time-course shows the rate slows with decreased serum, while comparison at the 24-hour time-point shows a linear increase in RWD between 0% and 10%. (B) Phase images at 24 hours post-scratch show reduced migration in the absence of serum, with segmentation masks shown for initial wound mask (blue) and wound closure over time (yellow). Images also allow for qualitative morphological assessment and indicate changes in cell morphology with a more elongated phenotype for 0% FBS. Data shown as mean ± SEM, n = 3 replicates. Image Credit: Sartorius
Pharmacological assessment of inhibitors of cell migration
Scratch wound assays are frequently utilized to pharmacologically evaluate compounds of interest. Two highly migratory cell types, MDA-MB-231 and HT-1080, were wounded and exposed to cytochalasin D (which inhibits actin polymerization) and PP242 (which is an mTOR inhibitor).
The microplate graph displays the RWD of such compounds over a period of 72 hours, emphasizing the consistency between replicates (see Figure 5A).
Cytochalasin D exhibited concentration-dependent inhibition for both cell lines, with higher potency for HT-1080 cells, while PP242 displayed concentration-dependent inhibition in MDA-MB-231 cells and partial inhibition in HT-1080 cells (see Figure 5B).
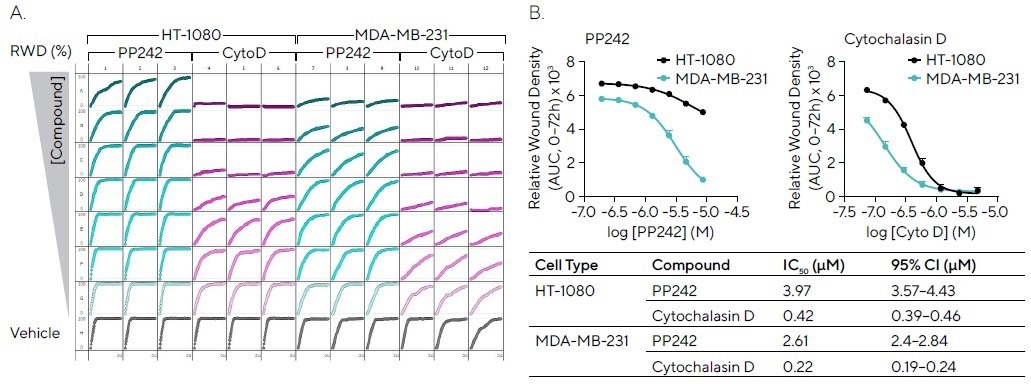
Figure 5. Pharmacological Assessment of Inhibitory Compounds in Cancer Cell Lines. HT-1080 and MDA-MB-231 cells (30,000 cells/well) were wounded and treated with PP242 (mTOR inhibitor) and cytochalasin D (actin polymerization inhibitor). (A) 96-well microplate graph showing relative wound density (RWD) over 72 hours enables visualization of cell migration in the presence of inhibitors. (B) Concentration response curves indicate the efficacy of each compound (AUC, 0--72h) in both cell types with IC50 values and confidence interval (CI) shown (Table). Data shown as mean ± SEM, n = 3 replicates. Image Credit: Sartorius
References
- Gagliardi P, Puliafito A, di Blasio L, et al. Real-time monitoring of cell protrusion dynamics by impedance responses. Scientific Reports. 2015;5(1).
- Kim D, Wirtz D. Focal adhesion size uniquely predicts cell migration. The FASEB Journal. 2012;27(4):1351-1361.
- Alix-Panabieres C, Magliocco A, Cortes-Hernandez L, Eslami-S Z, Franklin D, Messina J. Detection of cancer metastasis: past, present and future. Clinical & Experimental Metastasis. 2021;39(1):21-28.
- Yang J, Gong X, Ouyang L, He W, Xiao R, Tan L. PREX2 promotes the proliferation, invasion and migration of pancreatic cancer cells by modulating the PI3K signaling pathway. Oncology Letters. 2016;12(2):1139-1143.
- Gad S. Mitomycin C. In: Wexler P, ed. Encyclopedia of Toxicology (Third Edition). Academic Press; 2014:354-356.
- Kumar V, Ali M, Ramachandran C. Effect of mitomycin-C on contraction and migration of human nasal mucosa fibroblasts: implications in dacryocystorhinostomy. British Journal of Ophthalmology. 2015;99(9):1295-1300.
- Taniguchi M, Saito, K, Aida R, Ochiai A, Saitoh E, Tanaka T. Wound healing activity and mechanism of action of antimicrobial and lipopolysaccharide-neutralizing peptides from enzymatic hydrolysates of rice bran proteins. Journal of Bioscience and Bioengineering. 2019;128(2):142-148.
- Biswas D, Hyun S. Supplementation of fetal bovine serum increased the quality of in vitro fertilized porcine embryo. Journal of Advanced Veterinary and Animal Research. 2021;8(4).
- Fattahi S, Amjadi-Moheb F, Tabaripour R, Ashrafi G, Akhavan-Niaki H. PI3K/AKT/mTOR signaling in gastric cancer: Epigenetics and beyond. Life Sciences. 2020;262.
- Gupta S, Stuffrein S, Plattner R, Tencati M, Gray C, Whang Y, Stanbridge E. Role of Phosphoinositide 3-Kinase in the Aggressive Tumor Growth of HT1080 Human Fibrosarcoma Cells. Molecular and Cellular Biology. 2001;21(17):5846-5856.
About Sartorius

Sartorius is a leading international pharmaceutical and laboratory equipment supplier. With our innovative products and services, we are helping our customers across the entire globe to implement their complex and quality-critical biomanufacturing and laboratory processes reliably and economically.
The Group companies are united under the roof of Sartorius AG, which is listed on the Frankfurt Stock Exchange and holds the majority stake in Sartorius Stedim Biotech S.A. Quoted on the Paris Stock Exchange, this subgroup is comprised mainly of the Bioprocess Solutions Division.
Innovative technologies enable medical progress
A growing number of medications are biopharmaceuticals. These are produced using living cells in complex, lengthy and expensive procedures. The Bioprocess Solutions Division provides the essential products and technologies to accomplish this.
In fact, Sartorius has been pioneering and setting the standards for single-use products that are currently used throughout all biopharmaceutical manufacturing processes.
Making lab life easier
Lab work is complex and demanding: Despite repetitive analytical routines, lab staff must perform each step in a highly concentrated and careful way for accurate results.
The Lab Products and Services Division helps lab personnel excel because its products, such as laboratory balances, pipettes and lab consumables, minimize human error, simplify workflows and reduce physical workloads
Sponsored Content Policy: News-Medical.net publishes articles and related content that may be derived from sources where we have existing commercial relationships, provided such content adds value to the core editorial ethos of News-Medical.Net which is to educate and inform site visitors interested in medical research, science, medical devices and treatments.