The utilization of multi-cell tumor spheroids as an oncology research model has quickly increased because of a greater understanding of the effects of the tumor microenvironment, along with the spatial interactions between cells.
3D organoids and microtissues may offer more physiologically appropriate observations in comparison with 2D monolayer cell models, where cells are developed on non-biological surfaces in environments that are hyper-nourished which could disrupt metabolic studies or drug efficacy.1, 2
As the accessibility of 3D spheroid protocols rises, the experimental models are becoming more complicated with greater translational potential, frequently including further components that better simulate the heterogeneity of the cellular microenvironment.
The inclusion of the extracellular matrices (ECM) and different cell types observed inside the microenvironment is of significant importance for enhanced physiological relevance.
Extracellular matrix (ECM) components can be deposited by multi-cell spheroids, the same as a tumor in vivo, and the introduction of ECM scaffolds (for example Matrigel®) allows the cell-ECM interface to be explored in closer detail.
Spheroid models additionally have a higher degree of cell-to-cell contact to reflect structures better and to investigate the influence of cellular interactions on drug treatment3.
Similar to tumors, the spheroids start to exhibit internal layered structures as they grow, such as nutrient gradients and growth kinetics which could affect drug resistance.4 They also create gene expression profiles of a greater physiological relevance.1
Despite these advantages, contemporary techniques for evaluating the shrinkage and growth of 3D tumor spheroids cultured with ECM are restricted by one or more of the following: (1) assay workflows that are laborious, time-consuming, or expensive, needing trained users to perform the analysis; (2) a need to use fluorescent probes to label cells which can disturb biological responses and may not be appropriate for primary tissue; (3) single time point readouts that do not provide kinetic visualization of spheroid morphology or monitor the complete duration of growth; (4) the extraction of cells from physiological conditions for image acquisition; (5) indirect readouts (such as ATP) which can miss important morphological data and/or inaccurately report the growth of cells.
There is a demand for easily accessible, higher-throughput analysis and monitoring techniques that do not significantly disrupt cells. The techniques should be carried out in real time and for a long duration to provide temporal analysis of cellular growth, and additionally in the presence of ECM components to offer information that is more physiological relevant.
Assay principle
This white paper demonstrates the use of the Incucyte® 3D Multi-Tumor Spheroid Assays and the Incucyte® Live-Cell Analysis System to evaluate the development of 3D spheroids either label-free or with non-invasive reagents in real time, recording information that may be overlooked by single time point techniques.
The optimized depth of focus Brightfield (DF® Brightfield) image acquisition allows for the long term imaging of several tumor spheroids developed on a bed of extracellular matrix (Matrigel).
This optimized acquisition of images produces Brightfield images with high contrast, which can be easily masked utilizing built-in Incucyte® processing parameters. Brightfield eccentricity, object size, and count are instantly plotted over time and provide a breadth of information on the formation of spheroids, along with their growth and health rates.
Along with cells expressing fluorescent proteins and Incucyte® Cell Health reagents, the ability to measure fluorescence inside the Brightfield mask delivers objective information on spheroid death, viability, and the amount of apoptosis.
The capability to multiplex reagents with cell lines labeled with fluorescence offers additional knowledge about cellular mechanisms of action. Thousands of images can be taken, evaluated, and plotted, with the ability to run up to six 96-well plates in parallel for enhanced throughput.
Materials and methods

Figure 1: Assay Workflow. Image Credit: Sartorius
- A 96-well, flat-bottom plate is covered with a layer of Matrigel (Corning) (40 µL per well, diluted in serum-free media to a 4.5 mg/mL minimum concentration). This is then polymerized for 30 minutes at 37°C.
- Cells of interest are counted, harvested and seeded onto plates at intended densities (100 or 150 µL per well).
- If necessary, cell health reagents are included in 50 µL per well.
- At this stage, the total media volume should be 150 µL per well.
- The development of spheroids is tracked for 72 hours with HD phase-contrast and DF-Brightfield image acquisition every 6 hours at 10x magnification employing Incucyte®.
- Compounds are included (50 µL per well at 4x final assay concentration- FAC; or, if utilizing Cell Health reagents, 15 µL per well at 11x FAC).
- The spheroid shrinkage and growth assay is started and observed in the Incucyte® (6 hours of repetitive scanning, for up to 2 weeks). The size of the tumor is presented in real time using DF-Brightfield image analysis.
Life Technologies was the source of all cell culture reagents unless stated otherwise. SKOV3 (EACC) and MDA-MB-231 (ATCC) cultures were stably transfected with IncuCyte® NucLight Red Lentivirus Reagent (EF1 Alpha Promoter, Cat # 4625, Puromycin selection, prepared in line with Essen BioScience standards).
Incucyte® NucLight Red cell lines (A549-NR, Essen BioScience Cat # 4491; MCF-7-NR, Essen BioScience Cat # 4524) along with the prepared MDA-MB-231-NR and SKOV3-NR were developed to confluence in 75 cm2 tissue culture treated flasks.
They were then seeded into 96-well plates (Corning #3595) and covered with a base layer of 40 µL per well Matrigel so that spheroids developed with the intended size after 72 hours.
Each of the cells were cultured in F-12K medium supplemented with 0.5 µg/mL puromycin, 1% Glutamax, 1% Pen/ Strep, and 10% FBS. The development of spheroids was evaluated in an Incucyte® during a 72-hour period at intervals of 6 hours.
Cell viability of MDA-MB-231 cells was established utilizing Incucyte® Cytotox Green (Essen BioScience Cat # 4633). Apoptosis of A549 spheroids was assessed by the measurement of phosphatidylserine (PS) externalization (IncuCyte®Annexin V Green, Essen BioScience Cat # 4642).
Cell-type dependent label-free kinetic spheroid growth profiles
Tumor spheroid size was quantified over time by employing an automated software algorithm that shielded the Brightfield object in the field of view.
Modifications to the size of MCF-7, MDAMB-231, and A549 tumor spheroids were tracked over time, in the presence and absence of the cytotoxic compound camptothecin (CMP; Figure 2).
Kinetic growth profiles related to each cell type were determined for the evaluated cells. For each kind of cell, the control spheroids significantly increased during the 7-day period (2.4 to 3.7-fold) with the biggest increase in size found with MCF-7 spheroids.
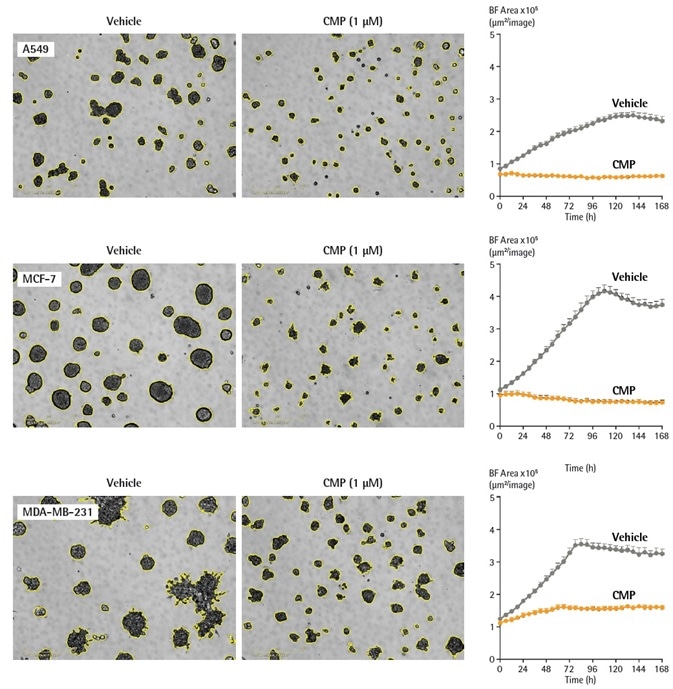
Figure 2. Quantification of cell-type dependent kinetic growth profiles of A549, MCF-7 and MDA-MB-231 spheroids using real time analysis. Cells were seeded in flat bottom 96-well plates (2,000 cells/well) on a bed of Matrigel and spheroids allowed to form (72 h). Spheroids were treated with either vehicle (0.1% DMSO) or CMP (1 µM). Segmented (yellow outline) DF-Brightfield images compare vehicle or CMP treated conditions at 168 h. Morphological differences are shown between round (A549, MCF-7) and stellate (MDA-MB-231) spheroids. Time courses show the individual well Total Brightfield Object Area (µm2) (y-axis) over 168 h and illustrate cell type specific kinetic growth profiles. Data were collected over 168 h period at 6 h intervals. All images captured at 10x magnification. Each data point represents mean ± SEM, n=6 wells. Image Credit: Sartorius
96-well spheroid growth and shrinkage assay for pharmacological analysis
To demonstrate the efficacy of this technique for use in drug toxicity research, a pharmacological investigation was carried out in MCF-7 breast cancer cells.
Spheroids were developed during 72 hours in flat bottom 96-well plate covered with a layer of Matrigel before treatment with camptothecin (CMP), the chemotherapeutic drug oxaliplatin (OXA), or cycloheximide (CHX) (Figure 3).
Each of the compounds generated an inhibition of spheroid growth depending on its concentration, showing how the potencies of compounds can be simply contrasted within the same assay.
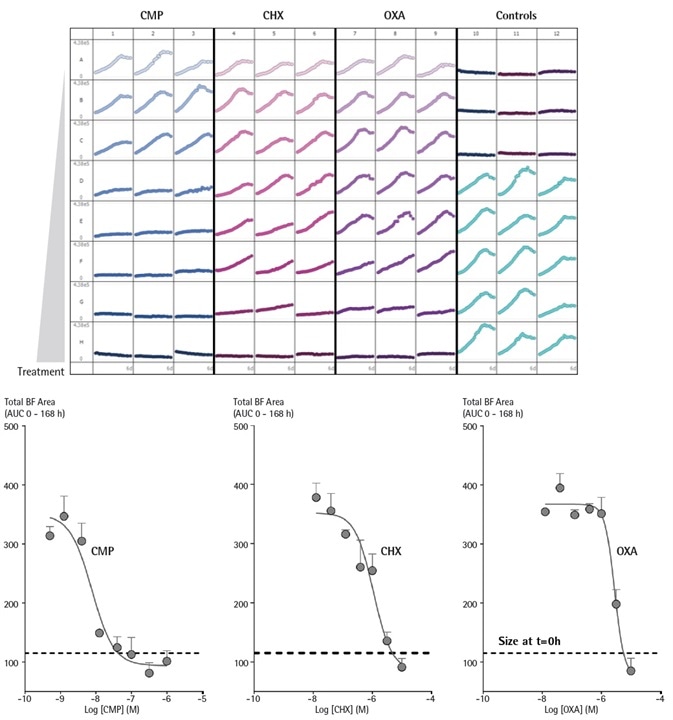
Figure 3. Incucyte® enables comparison testing of drug toxicities on growth of MCF-7 cells over time in a single microplate 3D spheroid assay. MCF-7 cells were seeded in flat bottom 96-well plates (1,000 cells/well) on a bed of Matrigel and spheroids allowed to form (72 h). Cells were then treated with serial dilutions of CMP, CHX, or OXA and spheroid growth kinetics obtained. The plate view shows the individual well Total Brightfield Object Area (µm2) (y-axis) over time (6 days) (x-axis). Concentration response curves (CRCs) represent the area under curve (AUC) of the Total Brightfield Area time course (µm2) from 0 – 168 h post-treatment. Data were collected over 168 h period at 6 h intervals. Each data point represents mean ± SEM, n=3 wells. Image Credit: Sartorius
Spheroid cell health characterization and drug response testing
Cell death assay
The inclusion of Incucyte® Cell Health reagents to this assay allows cell death to be traced.
Cell death can be identified utilizing Incucyte® Cytotox reagents that bind to DNA and become fluorescent when they come into contact with a vulnerable cell membrane (Incucyte® Cytotox Green/Red Reagent, Essen BioScience Cat # 4633/# 4632).
Apoptosis can be assessed through the activation of Caspase 3/7 (Incucyte® Caspase 3/7 Green Reagent, Essen BioScience Cat # 4440) or the measurement of phosphatidylserine (PS) externalization (Incucyte® Annexin V Green/ Red Reagent, Essen BioScience Cat # 4642/#4 641).
MDA-MB-231 cells, seeded in either the presence or absence of Incucyte® Cytotox Green reagent (250 nM), produced spheroids of comparative morphology and size (data not included).
Within the Brightfield boundary of the vehicle controls, fluorescence analysis showed little to no increase in fluorescence until 192 hours, upon which a small incline was noted. This indicates partial cell death at later points in time.
CMP generated a significant time-dependent incline in the intensity of fluorescence suggesting the loss of spheroid viability (Figure 4).
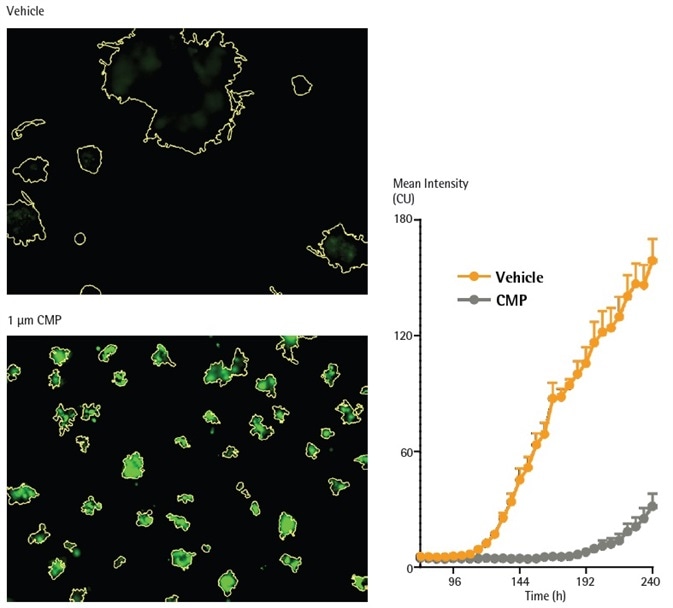
Figure 4. CMP induces loss of viability in MDA-MB-231 in 3D spheroid assay, as reported by Incucyte® Cytotox Green reagent. MDA-MB-231 cells were seeded in the presence of Incucyte® Cytotox Green reagent (250 nM) in flat bottom 96-well plates (1,000 cells/well, on a bed of Matrigel) and spheroids allowed to form (72h). Spheroids were treated with CMP (10 µM) or vehicle (0.1% DMSO). Fluorescent images compare vehicle or CMP treated conditions at 240 h (Brightfield outline mask shown in yellow). Time course shows loss of viability (increase in Incucyte® Cytotox Green fluorescence intensity). Image Credit: Sartorius
Determining mechanism of drug action using spheroid growth and viability
Critical information regarding a compound’s mechanism of action can be produced by combining the levels and size of apoptosis or cytotoxicity in spheroids.
While powerful as it does not utilize labeling, the Brightfield analysis does not entirely differentiate between cytostatic and cytotoxic agents because of the significant Brightfield signature of non-viable spheroids.
In contrast, establishing spheroid viability has the potential to distinguish between cytostatic and cytotoxic agents, with the former predicted to generate significant influence on spheroid size while facilitating little cell death.
The degree of spheroid apoptosis can be found by employing the Incucyte® Annexin V Apoptosis reagent (a probe for phosphatidylserine externalization) and can be measured utilizing the mean fluorescence inside the Brightfield boundary.
The influences of the cytostatic agent cycloheximide (CHX) and the cytotoxic agent camptothecin (CMP) were assessed on A549 spheroids produced in the vicinity of Incucyte® Annexin V Green (Figure 5).
Each of the agents exhibited concentration-dependent attenuation of spheroid growth, with CMP decreasing the size of the spheroid to smaller than what was seen at the time of treatment. Evaluation of Brightfield size provided IC50 values of 0.22 µM for CHX and 42 nM for CMP.
CMP interestingly triggered a significant increase in the mean fluorescence, indicating a cytotoxic mechanism. For apoptosis induction, the CMP EC50 value was 0.30 µM, similar to the value acquired from the size evaluation.
In contrast, CHX did not promote an increase in mean fluorescence which did not allow an EC50 to be established. The distinct separation between the cytotoxicity and size readouts assists the cytostatic mechanism of CHX.
Consistent, long-term live-cell analysis, performed in physiologically appropriate environments, enables the evaluation of concentration response curves with the least disruption to cellular biology, assisting in the calculation of significant EC50 values.
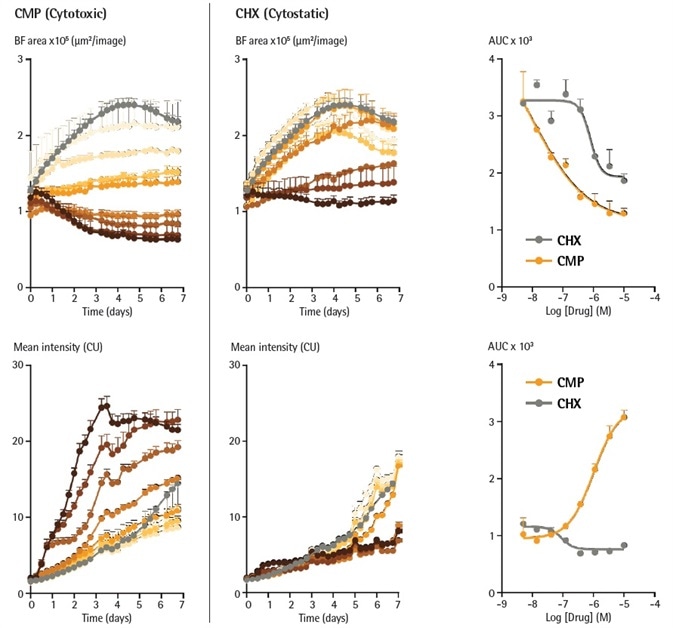
Figure 5. Cytotoxic and cytostatic mechanisms of action can be differentiated by measuring spheroid size and apoptosis over time. A549 cells were seeded in the presence of Incucyte® Annexin V Green reagent (1 %) in flat bottom 96-well plates (2,000 cells/well, on a bed of Matrigel) and spheroids allowed to form (96 h). Spheroids were then treated with increasing concentrations of CMP (left column, 4 nM – 10 µM) or CHX (right column, 4 nM – 10 µM). Time courses show change in size (Brightfield Area) or apoptosis (Incucyte® Annexin V fluorescence intensity) over time. CRCs show the different profiles of cytotoxic and cytostatic mechanisms. Image Credit: Sartorius
Monitoring spheroid response to cytotoxic challenge over time with fluorescent proteins
Within the cells of a spheroid, the expression of fluorescent proteins provide a readout of cell viability, where cytotoxic challenge will result in a loss of fluorescence signal, and spheroid growth results in an increase in fluorescence. Covering the Brightfield channel allows the objects of interest to be identified.
The use of the ‘fluorescence within the Brightfield boundary’ feature in the Incucyte® S3 Spheroid Analysis software module enables the identification of fluorescence intensity of the pixels included inside the object of interest.
Utilizing the integrated fluorescence intensity inside the Brightfield boundary offers a relevant assessment for identifying both the death and growth of labeled spheroids from one readout.
MCF-7 cells stably expressing a red fluorescent protein (Incucyte® NucLight Red) produced dense spheroids with equivalent features to the wild-type cells established on Brightfield analysis (data not presented).
Fluorescent calculations (integrated intensity within the Brightfield boundary) were performed after the formation stage of three days (Figure 6). The fluorescence intensity increased corresponding to the increase in spheroid size in vehicle-treated spheroids.
The inclusion of CMP (0.4 nM to 1 µM) yielded a significant decrease in fluorescence, reaching background levels after 144 hours. As outlined before, the fluorescence inside a Brightfield boundary evaluation removes the requirement to apply a fluorescence mask which negates the influence of threshold settings.
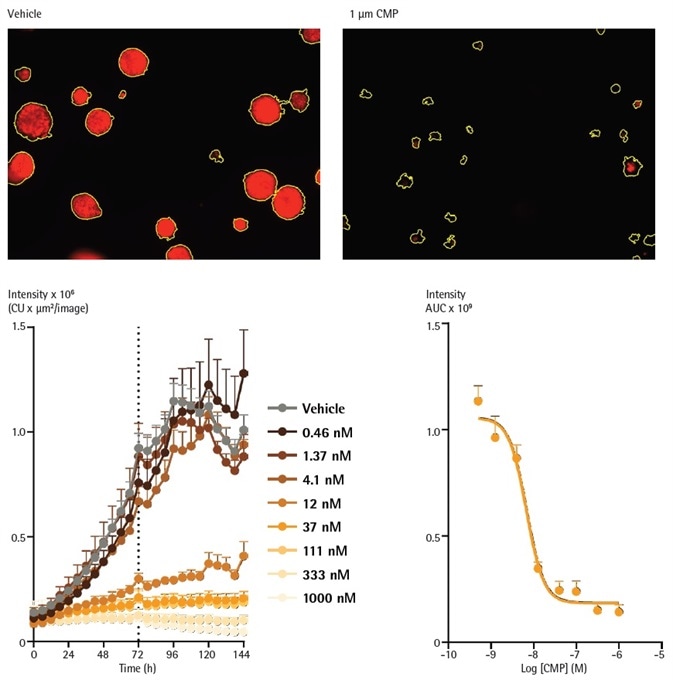
Figure 6. Analysis of spheroids expressing fluorescent proteins enables determination of concentration-dependent spheroid viability over time. MCF-7 cells were seeded in flat bottom 96-well plates (1,000 cells/well) on a bed of Matrigel and spheroids allowed to form (72h). Representative images taken at 144 h show a strong red fluorescent signal in a vehicle (0.1% DMSO) treated spheroids and a marked loss of red fluorescence in CMP treated spheroids. The yellow boundary in the images represents the Brightfield mask outline. Monitoring the integrated intensity from within the Brightfield boundary highlights increasing fluorescence under vehicle control conditions corresponding to the growth of the spheroid. Upon treatment with CMP (0.4 nM – 1 µM), a concentration dependent reduction in integrated fluorescence is observed, with abolishment of fluorescence with the highest concentration tested after 144 h. Image Credit: Sartorius
Conclusions
This white paper outlined how the Incucyte® Live-Cell Analysis System, along with validated Incucyte® Cell Health Reagents and the Incucyte® Spheroid Software Module, facilitates the investigation of 3D multi-spheroids over time and is suitable for drug testing. The following has been demonstrated:
- Live-cell imaging uncovered morphological variations between MDA-MB-231, MCF-7, and A549 cells (stellate vs. round).
- The system produced kinetic growth profiles dependent on cell type for a range of cells.
- Comparison evaluations of drug toxicities of oxaliplatin (OXA), cycloheximide (CHX), and camptothecin (CMP) were simply carried out within a single assay.
- The temporal loss of cell viability in reaction to treatment with CMP was recorded utilizing the Cytotox Green reagent.
- This assay could differentiate between cytostatic and cytotoxic functions of drug action in the reaction to cycloheximide (CHX) and camptothecin (CMP) respectively.
- Concentration dependent variations in spheroid viability were observed across time with the fluorescent protein, Incucyte® NucLight Red, in reaction to the cytotoxic challenge of CMP.
Multiple capabilities of the Incucyte® Live-Cell Analysis System are especially beneficial for objectively quantifying and monitoring 3D spheroid kinetics and profiling growth rates for various types of spheroid.
The DF-Brightfield imaging enables the label-free investigation of 3D spheroid growth, shrinkage, and morphology in 96-well assay formats for optimized throughput. There is no requirement to choose predetermined end points. The system generates a constant Brightfield segmentation with well-to-well kinetic data that is reproducible.
The automated image acquisition of this system, in harmony with laboratory-tested protocols and user-friendly analysis tools, helps non-expert users to efficiently gather reproducible information, carry out investigations, and produce graphics that are publication-ready.
Combined together, the reagents, Spheroid Software Module, and the Incucyte® Live-Cell Analysis System facilitates an efficient and unique technical platform that can be included into existing workflows.
This system offers non-invasive, kinetic physiological identification of spheroid viability and growth, and is applicable to pharmacological development and discovery.
References and further reading
- Verjans ET. Three-dimensional cell culture models for anticancer drug screening: Worth the effort? Cell Physiol. Apr; 233(4):2993-3003 (2018)
- Ravi M, Ramesh A, and Pattabhi A. Contributions of 3D Cell Cultures for Cancer Research. J Cell Physiol. Oct; 232(10):2679- 2697 (2017)
- Costa EC et al. 3D tumor spheroids: an overview on the tools and techniques used for their analysis. Biotechnol Adv. Dec; 34(8); 1427-1441 (2016)
- Thoma CR, et al. 3D cell culture systems modelling tumor growth determinants in cancer target discovery. Adv Drug Deliv Rev. Apr; 69-70:29-41 (2014) URL: http://cancerres.aacrjournals.org/content/78/13_Supplement/5030.short
Recent publications with Incucyte®
Tumorsphere growth kinetics and cell number
Cazet AS, et al. Targeting stromal remodeling and cancer stem cell plasticity to overcome chemoresistance in triple negative breast cancer. Nat Commun. Jul 24; 9(1):2897 (2018)
Tumor microenvironment
Salo T., et al. Organotypic three-dimensional assays based on human leiomyoma-derived matrices. Philos Trans R Soc Lond B Biol Sci. Jan 5; 373(1737) (2018)
Stroma and 3D culture
Bohovic R et al. 3D multicellular models reflect the efficiency of MSC-directed enzyme/prodrug treatment. Neoplasma. 62(4):521-30 (2015)
Posters
- AACR 2018
- Discover more information on the Publications and Webinars pages.
More information on Incucyte® multi-spheroid
Assays and software
- Incucyte® S3 Multi-Spheroid Assays
- Incucyte® S3 Spheroid Software Module
- Watch Video of Real Time Spheroid Kinetic Analysis inside the Incubator
IncuCyte multi-spheroid protocol
- Incucyte® S3® Multi-Spheroid Assay Protocol
Related applications
- Incucyte® S3 Single Spheroid Assays
- Incucyte® Proliferation Assays for Live-Cell Analysis
- Cytotoxicity Assays for Live-Cell Analysis
- Apoptosis Assays for Live-Cell Analysis
- Incucyte® Immune Cell Killing Assays for Live-Cell Analysis
Product inquiry
Online Product Inquiry
Reagent ordering information
Source: Sartorius
| Product |
Cat No. |
Size |
| Incucyte® S3 Spheroid Software Module |
9600-0019 |
1 module |
| Incucyte® Nuclight Green Lentivirus (EF-1a Promoter, Puro selection) Nuclear Labeling Reagent |
4624 |
1 vial (0.2 mL) |
| Incucyte® Nuclight Red Lentivirus (EF-1a Promoter, Puro selection) Nuclear Labeling Reagent |
4625 |
1 vial (0.2 mL) |
| Incucyte® CytoLight Green Lentivirus (EF-1a Promoter, Puro selection) Cytoplasmic Labeling Reagent |
4481 |
1 vial (0.6 mL) |
| Incucyte® CytoLight Red Lentivirus (EF-1a Promoter, Puro selection) Cytoplasmic Labeling Reagent |
4482 |
1 vial (0.6 mL) |
| Incucyte® Caspase-3/7 Green Apoptosis Reagent |
4440 |
One vial (20 μL) |
| Incucyte® Annexin V Red Reagent |
4641 |
One vial (100 tests) |
| Incucyte® Annexin V Green Reagent |
4642 |
One vial (100 tests) |
| Incucyte® Cytotox Red Reagent |
4632 |
Five vials (5 μL) |
| Incucyte® Cytotox Green Reagent |
4633 |
Five vials (5 μL) |
Acknowledgments
Produced from materials originally authored by Miniver Oliver1, Kalpana Patel1, Gillian Lovell1, Nicholas Dana2, Tim Jackson2, Nevine Holtz2, Eric Endsley2, Jill Granger2, Tim Dale1, and Del Trezise1 from:
1. Essen BioScience, Ltd., United Kingdom
2. Essen BioScience, Inc., USA
About Sartorius

Sartorius is a leading international pharmaceutical and laboratory equipment supplier. With our innovative products and services, we are helping our customers across the entire globe to implement their complex and quality-critical biomanufacturing and laboratory processes reliably and economically.
The Group companies are united under the roof of Sartorius AG, which is listed on the Frankfurt Stock Exchange and holds the majority stake in Sartorius Stedim Biotech S.A. Quoted on the Paris Stock Exchange, this subgroup is comprised mainly of the Bioprocess Solutions Division.
Innovative Technologies Enable Medical Progress
A growing number of medications are biopharmaceuticals. These are produced using living cells in complex, lengthy and expensive procedures. The Bioprocess Solutions Division provides the essential products and technologies to accomplish this.
In fact, Sartorius has been pioneering and setting the standards for single-use products that are currently used throughout all biopharmaceutical manufacturing processes.
Making Lab Life Easier
Lab work is complex and demanding: Despite repetitive analytical routines, lab staff must perform each step in a highly concentrated and careful way for accurate results.
The Lab Products and Services Division helps lab personnel excel because its products, such as laboratory balances, pipettes and lab consumables, minimize human error, simplify workflows and reduce physical workloads
Sponsored Content Policy: News-Medical.net publishes articles and related content that may be derived from sources where we have existing commercial relationships, provided such content adds value to the core editorial ethos of News-Medical.Net which is to educate and inform site visitors interested in medical research, science, medical devices and treatments.