Sponsored Content by SartoriusReviewed by Maria OsipovaAug 27 2025
Cell migration is a multistep process essential to various physiological functions, including immune cell movement and embryonic development, as well as pathological conditions like tumor metastasis. This process begins when environmental cues trigger the rearrangement of actin filaments and microtubules at the cell's leading edge.1
At the leading edge, the cell forms tight, integrin-based focal adhesions that help it grip and move across the substrate.2 The cycle is completed when the trailing edge of the cell retracts, an action that, when repeated quickly and in sequence, drives the overall movement of the cell.
Metastasis, a defining characteristic of cancer, is closely tied to disruptions in the signaling pathways that regulate cell migration. It occurs when malignant cells detach from their original site and travel through the vascular or lymphatic systems to establish secondary tumors.3
Cell migration, along with related behaviors like invasion, plays a central role in both tumor formation and persistence. Gaining deeper insights into these mechanisms is key to developing therapies that can better control tumor spread and survival.
Traditional methods for studying cell migration, such as scratching a cell layer with a narrow object to mimic a wound, can be time-intensive, inconsistent, and typically rely on endpoint analysis. In contrast, live-cell imaging techniques now offer a more reliable way to observe and quantify cell migration in real time.
Assay principle
This application note outlines the utility of the Incucyte® Scratch Wound Cell Migration Assay, which combines the Incucyte® Live-Cell Analysis System with the Incucyte® Scratch Wound Analysis Software Module to provide automated, image-based measurements of cell migration in vitro.
The assay offers flexibility and consistency across a wide range of cell lines and compounds. In this example, the assay is used to visualize and quantify cell migration kinetics in a 96-well plate format.
Materials and methods
The Incucyte® Scratch Wound Assay features a straightforward protocol using the Incucyte® 96-Well WoundMaker Tool to create precise, uniform wounds across cell monolayers cultured in Incucyte® Imagelock 96-well Plates (Figure 1).
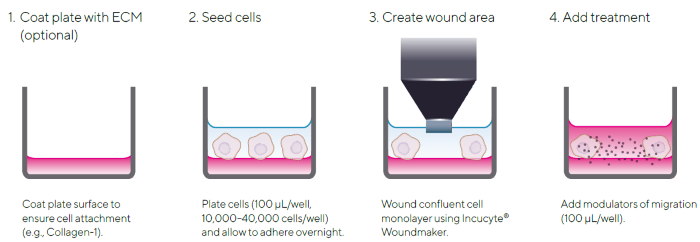
Figure 1. Quick Guide of Incucyte® Scratch Wound Assay Protocol. The simple protocol utilizes the Incucyte® Woundmaker and the Incucyte® Live-Cell Analysis System for image-based measurements of cell migration in real time. Image Credit: Sartorius
The use of Imagelock Plates enables the integrated Incucyte® software to automatically detect and register wound locations, streamlining the analysis process.
- Wells were either left uncoated or coated with a biomatrix to promote tight cell adherence.
- The selected cell type was seeded into an Incucyte® Imagelock 96-well Plate and incubated overnight at 37 °C with 5 % CO2.
- Optional: To distinguish migration from proliferation, confluent cells may be pre-treated with an anti-proliferative agent such as mitomycin C (MMC). Concentration and incubation time should be optimized for each specific cell line.
- Once confluence was achieved, a uniform wound was introduced into each well using the Incucyte® 96-Well WoundMaker Tool.
- After washing, treatment media were added at 100 µL per well, using a 1X final assay concentration (FAC).
Quantification of cell migration
The Incucyte® Scratch Wound Analysis Software Module enables automated, real-time quantification of cell migration using either label-free or dual-fluorescence readouts. In this study, two key proteins from the PI3K-Akt signaling pathway, phosphoinositide 3-kinase (PI3K) and its negative regulator, phosphatase and tensin homolog (PTEN) were evaluated for their roles in cell migration.4
HeLa wild-type (WT) cells were compared with two knockout cell lines lacking either PI3K (abcam, ab257029) or PTEN (abcam, ab255419).
Phase-contrast images of HeLa WT cells were captured over a 24-hour period, with segmentation masks highlighting the initial wound area (blue) and subsequent closure over time (yellow) (Figure 2A). Migration was quantified using the Relative Wound Density (RWD) metric, which compares cell density inside the wound to the surrounding area.
Results showed a reduced migration rate in both knockout lines: at 48 hours, RWD reached 60 % in WT cells, compared to 40 % and 38 % in the PI3K and PTEN knockouts, respectively (Figure 2B). Notably, complete wound closure was not observed in any of the cell lines.
These findings demonstrate the utility of the assay for comparing migration phenotypes across cell lines and investigating the functional roles of proteins involved in migratory signaling pathways.
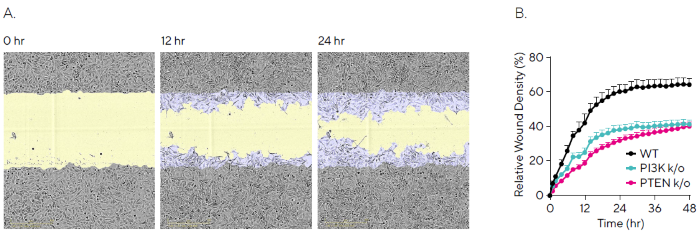
Figure 2. Quantifying Migration Profiles of HeLa WT and Knockout Cell Lines. HeLa WT, HeLa PI3K knockout and HeLa PTEN knockout cell lines were seeded into an Incucyte® Imagelock Plate (30,000 cells/well) and allowed to adhere overnight. Precise, reproducible wounds were created using the Incucyte® Woundmaker Tool and phase-contrast images were acquired every 2 hours using the Incucyte® Live-Cell Analysis System. (A) Time-lapse phase images shown migration for HeLa WT cells over 24 hours, with segmentation masks shown for initial scratch (blue) and wound closure over time (yellow). (B) Kinetic quantification revealed differential migration rates for WT vs knockout cells, which plateaued by 48 hours for all cell lines. Data shown as mean ± SEM, n = 12 replicates. Image Credit: Sartorius
Optimization of migration assay conditions
An important consideration in cell migration assays is that wound closure may be influenced not only by migration but also by cell proliferation. Mitomycin C (MMC), a widely used anti-proliferative agent, helps distinguish between these two processes in scratch wound assays.5-7
To investigate this, MDA-MB-231 and BxPC3 cells were wounded after incubation with 50µM MMC and phase images acquired (Figure 3A).
By 24 hours, MDA-MB-231 cells exhibited a faster migration rate, reaching a Relative Wound Density (RWD) of 95.3 %, compared to 66.9 % in BxPC3 cells under vehicle control conditions (Figure 3B). In MDA-MB-231 cells, MMC had no measurable impact on migration, suggesting that wound closure was primarily driven by cell movement.
In contrast, the slower-migrating BxPC3 cells demonstrated a greater opportunity for proliferation to contribute to wound closure. Pre-incubation with MMC reduced migration compared to vehicle, indicating that proliferation plays a role in this process for BxPC3.
These findings underscore the value of using anti-proliferative agents to standardize results and accurately assess migration in certain cell types.
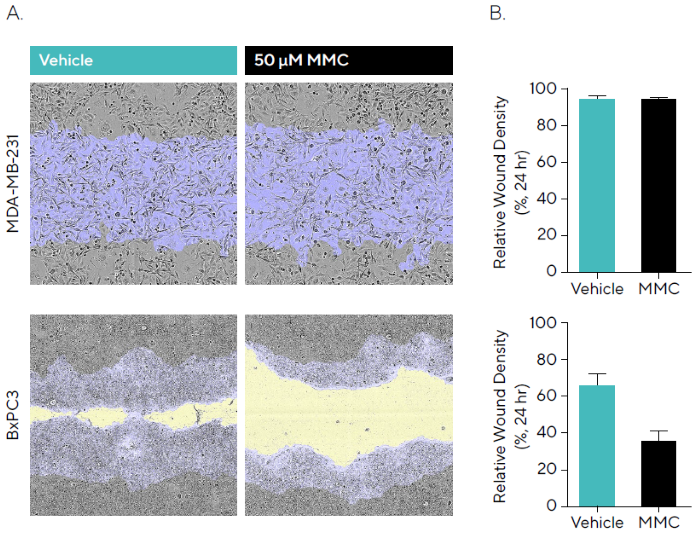
Figure 3. Anti-Proliferative Effects of Mitomycin C (MMC) During Cell Migration. MDA-MB-231 and BxPC3 cells were seeded (30,000 cells/well and 50,000 cells/well, respectively) and, once a monolayer had formed, pre-treated with 50 μM MMC for 4 hours. Cells were wounded, washed and migration was monitored using the Incucyte® Live-Cell Analysis System. (A) Phase images at 24 hours show reduced wound closure in the presence of MMC in BxPC3 but not MDAMB- 231 cells compared to vehicle. Segmentation masks shown for initial wound mask (blue) and wound closure over time (yellow). (B) Bar graphs indicate that for MMC, BxPC3 showed attenuated migration compared to vehicle, while MDA-MB-231 cells showed no reduction indicating wound closure is driven by migration. Data shown as mean ± SEM, n = 6–8 replicates. Image Credit: Sartorius
Fetal bovine serum (FBS) is a standard component of cell culture media, providing essential factors that support cell attachment, growth, and proliferation.8 To assess the impact of serum concentration on migration, T98G cells were exposed to varying levels of FBS (0–10 %) (Figure 4).
In serum-free conditions (0 % FBS), cells exhibited a Relative Wound Density (RWD) of 63.6 % after 24 hours. As FBS concentration increased, migration rates also rose, reaching a peak RWD of 92.6 % in the presence of 10 % FBS (Figure 4A).
In addition to changes in migration, serum levels appeared to influence cell morphology. Cells with 0% FBS applied displayed a more elongated phenotype, whereas those in 10 % FBS showed a more spread, extensive morphology (Figure 4B).
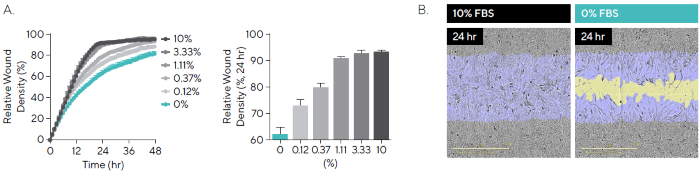
Figure 4. Cell Migration in the Presence of Serum. T98G glioblastoma cells were seeded onto PDL pre-coated Incucyte® Imagelock Plates (30,000 cells/well) and wounded after 24 hours. Media was added containing fetal bovine serum (FBS; 0–10%). (A) Time-course shows the rate slows with decreased serum, while comparison at the 24-hour time-point shows a linear increase in RWD between 0% and 10%. (B) Phase images at 24 hours post-scratch show reduced migration in the absence of serum, with segmentation masks shown for initial wound mask (blue) and wound closure over time (yellow). Images also allow for qualitative morphological assessment and indicate changes in cell morphology with a more elongated phenotype for 0% FBS. Data shown as mean ± SEM, n = 3 replicates. Image Credit: Sartorius
Pharmacological assessment of inhibitors of cell migration
Scratch wound assays are frequently used to pharmacologically evaluate the effects of test compounds on cell migration. In this study, two highly migratory cell lines, HT-1080 and MDA-MB-231, were wounded and treated with either PP242, an mTOR inhibitor, or cytochalasin D, which disrupts actin polymerization.
Relative Wound Density (RWD) was tracked over a 72-hour period, and the resulting microplate graph demonstrated strong consistency across replicates (Figure 5A).
Cytochalasin D produced a concentration-dependent inhibition of migration in both cell lines, with greater potency observed in HT-1080 cells. PP242 also showed concentration-dependent inhibition in MDA-MB-231 cells, while HT-1080 cells exhibited only partial inhibition in response to the same treatment (Figure 5B).
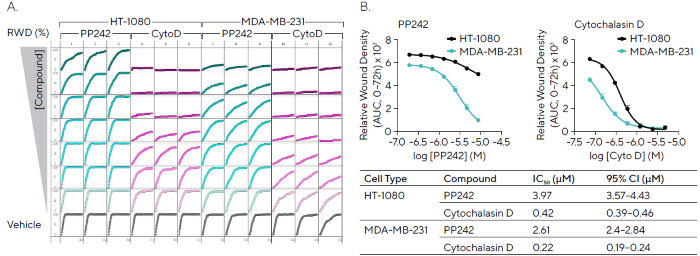
Figure 5. Pharmacological Assessment of Inhibitory Compounds in Cancer Cell Lines. HT-1080 and MDA-MB-231 cells (30,000 cells/well) were wounded and treated with PP242 (mTOR inhibitor) and cytochalasin D (actin polymerization inhibitor). (A) 96-well microplate graph showing relative wound density (RWD) over 72 hours enables visualization of cell migration in the presence of inhibitors. (B) Concentration response curves indicate the efficacy of each compound (AUC, 0--72 h) in both cell types with IC50 values and confidence interval (CI) shown (Table). Data shown as mean ± SEM, n = 3 replicates. Image Credit: Sartorius
HT-1080 fibrosarcoma cells and 3T3 murine embryonic fibroblasts were used to evaluate the effects of three PI3K inhibitors.9 Time-course data revealed distinct migratory profiles for each compound, with greater inhibitory potency observed in 3T3 cells compared to HT-1080 cells (Figure 6).
This difference in sensitivity may be attributed to the presence of an activated n-RAS oncogene in HT-1080 cells, which can drive sustained signaling and potentially confer resistance to inhibitors targeting downstream pathways such as PI3K.10
Among the tested compounds, the selective PI3K inhibitor Wortmannin demonstrated stronger inhibition of migration in HT-1080 cells compared to non-selective inhibitors. These findings illustrate how the assay can be used to generate detailed, comparative profiles of compound activity across different cell types.
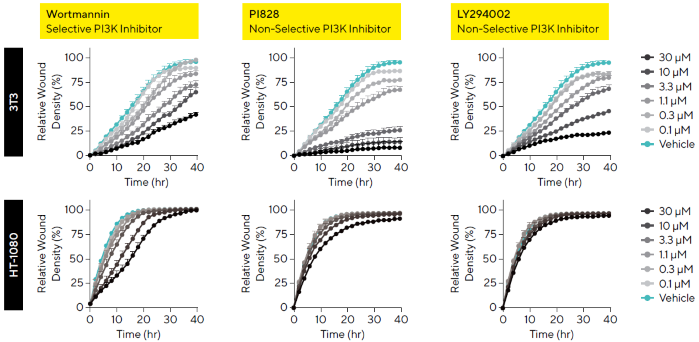
Figure 6. Cell-Type and Molecule-Dependent Temporal Cell Migration Profiles. 3T3 and HT-1080 cells (30,000 cells/well) were wounded and treated with a concentration range (0.1--30 μM) of PI3K inhibitors: Wortmannin, PI828, and LY294002. Data show varying kinetic migratory profiles in the presence of different compounds. PI3K inhibitors showed a significant difference in efficacy across cell types with HT-1080 cells appearing more resistant to PI3K inhibition compared to 3T3 cells. Data shown as mean ± SEM, n = 3 replicates. Image Credit: Sartorius
Cell cycle and migration
Cell migration and proliferation are critical to both physiological and pathological processes, including tumor metastasis. Insights into cell cycle progression can be gained using cells expressing the Incucyte® Cell Cycle Lentivirus Reagents.
These cells exhibit green fluorescence during the S/G2/M phases, red (or orange) fluorescence in G1, yellow fluorescence during the G1→S transition (resulting from red/orange + green overlap), and no fluorescence during the M→G1 transition (Figure 7A).
The Incucyte® Scratch Wound Analysis Software Module enables quantification of the dominant cell cycle populations, green and red (or orange), within the wound area.
Cell counts for each color are expressed as a percentage of the total red + green population in the wound, allowing real-time characterization of both migration and cell cycle dynamics.
In this experiment, HT-1080 cells expressing the Incucyte® Cell Cycle Green/Red Lentivirus were wounded and treated with cytochalasin D. Fluorescence imaging revealed that cytochalasin D inhibited both cell migration and progression through the cell cycle, with a higher proportion of cells arrested in G1 (red fluorescence) compared to the vehicle control (Figure 7B).
Time-course data supported these findings, showing reduced migration (as measured by RWD) and an increased percentage of G1-phase cells (% Red Population) in response to cytochalasin D (Figure 7C).
These results align with previous studies showing that cytochalasin D disrupts actin polymerization, thereby impairing migration and activating p53-dependent pathways that lead to G1-S phase arrest.11
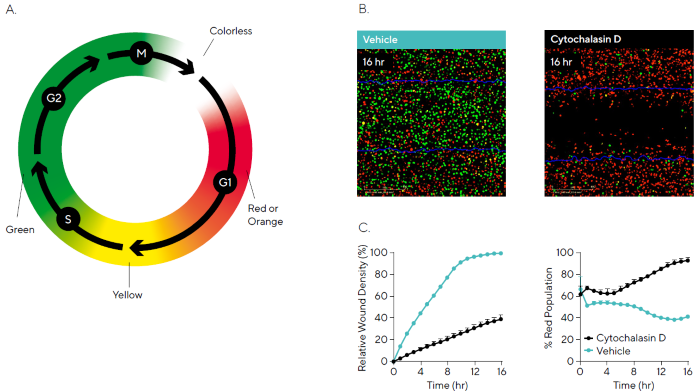
Figure 7. Concurrent Measurements of Cell Cycle Progression and Cell Migration. HT-1080 cells stably expressing the Incucyte® Cell Cycle Green/ Red Lentivirus (30,000 cells/well) were wounded and then treated with 0.31 μM cytochalasin D. Phase and dual fluorescence metrics were used to quantify cell migration and cell cycle progression, respectively. (A) Schematic displays the fluorescence color expression of cells during the cell cycle. Utilizing the Incucyte® Scratch Wound Analysis Software Module we can quantify cells exhibiting red fluorescence in G1 and green fluorescence in S|G2|M. (B) Green and red fluorescence images reveal inhibition of cell migration (initial scratch outline in blue) and a high population in red, indicating cell cycle arrest in G1 for cytochalasin D compared to vehicle. (C) Time-courses indicate that cytochalasin D has an inhibitory effect on cell migration (Relative Wound Density) and the cell cycle through arresting in G1 (% Red Population). Data shown as mean ± SEM, n = 3 replicates. Image Credit: Sartorius
To compare the mechanistic effects of compounds on migration and cell cycle progression, MDA-MB-231 Cell Cycle cells were treated with the anti-migratory agent PP242 and the anti-proliferative agent mitomycin C (MMC).
Time-course analysis showed that PP242 impacted both wound closure and cell cycle progression in a concentration-dependent manner, resulting in impaired migration and arrest in the G1 phase (red fluorescence). Data transformation revealed IC50 and EC50 values of 1.69 µM and 0.95 µM, respectively (Figure 8A).
In contrast, MMC had no measurable effect on migration over 24 hours but did induce a concentration-dependent arrest in the S/G2/M phases (green fluorescence), with an IC50 of 1.25 µM (Figure 8B).
Fluorescence imaging further illustrates these compound effects, showing differences in wound closure (with the initial scratch outline marked in blue) and cell cycle phase distribution (green or red fluorescence) relative to vehicle control (Figure 8C).
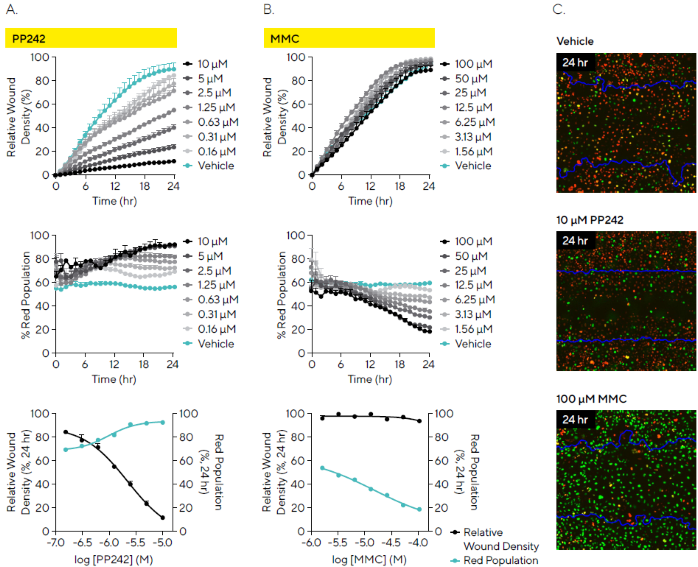
Figure 8. Differential Effects of Compounds on Cell Cycle and Cell Migration. MDA-MB-231 cells stably expressing Incucyte® Cell Cycle Green/Red Lentivirus (30,000 cells/well) were wounded and treated with PP242 or mitomycin C (MMC). Time-courses and concentration response curves indicate: (A) PP242 had a concentration-dependent effect on cell migration (relative wound density) and the cell cycle with an increase in the red cell population (G1) within the wound (red population); (B) In contrast MMC had no little-to-no effect on migration but had a concentration-dependent effect on the cell cycle with an arrest in green (S|G2|M) as shown by a decreasing red population; (C) Fluorescence images enable visualization of cell migration (initial scratch outline in blue) and cell cycle arrest for treated and vehicle conditions (24 hours post-scratch). Data shown as mean ± SEM, n = 3 replicates. Image Credit: Sartorius
Summary and outlook
This article highlights the Incucyte® Scratch Wound Assay as a versatile and robust tool for quantifying cell migration.
High-resolution imaging allows researchers to visualize morphological changes over time, while the integrated analysis software delivers precise kinetic and pharmacological profiles. The addition of dual fluorescence readouts provides further insight, enabling simultaneous measurement of cell cycle dynamics and migration.
Given the critical role of cell migration in cancer and other disease processes, enabling streamlined, real-time analysis is essential for driving deeper understanding and supporting the development of more effective therapies.
References
- Gagliardi, P.A., et al. (2015). Real-time monitoring of cell protrusion dynamics by impedance responses. Scientific Reports, (online) 5(1), p.10206. https://doi.org/10.1038/srep10206.
- Kim, D. and Wirtz, D. (2012). Focal adhesion size uniquely predicts cell migration. The FASEB Journal, 27(4), pp.1351–1361. https://doi.org/10.1096/fj.12-220160..
- Alix-Panabieres, C., et al. (2021). Detection of cancer metastasis: past, present and future. Clinical & Experimental Metastasis, 39(1), pp.21–28. https://doi.org/10.1007/s10585-021-10088-w.
- Yang, J., et al. (2016). PREX2 promotes the proliferation, invasion and migration of pancreatic cancer cells by modulating the PI3K signaling pathway. Oncology letters, (online) 12(2), pp.1139–1143. https://doi.org/10.3892/ol.2016.4688.
- Wexler, P. (2014). Encyclopedia of toxicology. 3rd ed. London ; San Diego, Ca: Elsevier/Academic Press. https://shop.elsevier.com/books/encyclopedia-of-toxicology/wexler/978-0-12-386454-3.
- Kumar, V., Ali, M.J. and Ramachandran, C. (2015). Effect of mitomycin-C on contraction and migration of human nasal mucosa fibroblasts: implications in dacryocystorhinostomy. The British journal of ophthalmology, (online)] 99(9), pp.1295–300. https://doi.org/10.1136/bjophthalmol-2014-306516.
- Taniguchi, M., et al. (2019). Wound healing activity and mechanism of action of antimicrobial and lipopolysaccharide-neutralizing peptides from enzymatic hydrolysates of rice bran proteins. Journal of Bioscience and Bioengineering, (online) 128(2), pp.142–148. https://doi.org/10.1016/j.jbiosc.2019.02.002.
- Biswas, D. and Hyun, S.H. (2021). Supplementation of fetal bovine serum increased the quality of in vitro fertilized porcine embryo. Journal of advanced veterinary and animal research, (online) 8(4), pp.589–596. https://doi.org/10.5455/javar.2021.h549.
- Fattahi, S., et al. (2020). PI3K/AKT/mTOR signaling in gastric cancer: Epigenetics and beyond. Life Sciences, 262, p.118513. https://doi.org/10.1016/j.lfs.2020.118513.
- Gupta, S., et al. (2001). Role of Phosphoinositide 3-Kinase in the Aggressive Tumor Growth of HT1080 Human Fibrosarcoma Cells. Molecular and Cellular Biology, 21(17), pp.5846–5856. https://doi.org/10.1128/mcb.21.17.5846-5856.2001.
- Trendowski, M. (2015). Using Cytochalasins to Improve Current Chemotherapeutic Approaches. Anti-Cancer Agents in Medicinal Chemistry, 15(3), pp.327–335. https://doi.org/10.2174/1871520614666141016164335.
About Sartorius
Sartorius is a leading international pharmaceutical and laboratory equipment supplier. With our innovative products and services, we are helping our customers across the entire globe to implement their complex and quality-critical biomanufacturing and laboratory processes reliably and economically.
The Group companies are united under the roof of Sartorius AG, which is listed on the Frankfurt Stock Exchange and holds the majority stake in Sartorius Stedim Biotech S.A. Quoted on the Paris Stock Exchange, this subgroup is comprised mainly of the Bioprocess Solutions Division.
Innovative technologies enable medical progress
A growing number of medications are biopharmaceuticals. These are produced using living cells in complex, lengthy and expensive procedures. The Bioprocess Solutions Division provides the essential products and technologies to accomplish this.
In fact, Sartorius has been pioneering and setting the standards for single-use products that are currently used throughout all biopharmaceutical manufacturing processes.
Making lab life easier
Lab work is complex and demanding: Despite repetitive analytical routines, lab staff must perform each step in a highly concentrated and careful way for accurate results.
The Lab Products and Services Division helps lab personnel excel because its products, such as laboratory balances, pipettes and lab consumables, minimize human error, simplify workflows and reduce physical workloads.
Sponsored Content Policy: News-Medical.net publishes articles and related content that may be derived from sources where we have existing commercial relationships, provided such content adds value to the core editorial ethos of News-Medical.Net which is to educate and inform site visitors interested in medical research, science, medical devices and treatments.