Sponsored Content by SartoriusReviewed by Maria OsipovaOct 9 2025
Jasmine Trigg1, John Rauch2, Libby Oupicka2, Clare Szybut1, Nicola Bevan1, Kalpana Barnes1
1 Sartorius UK, Units 2 & 3 The Quadrant, Newark Close, Royston Hertfordshire SG8 5HL United Kingdom
2 Sartorius Corporation, 300 West Morgan Road, Ann Arbor, MI 48108 USA
Cytotoxicity is a broad term that refers to the negative effects of chemical or environmental changes on cell health. Cells exposed to a cytotoxic stimulus may lose metabolic activity, experience growth inhibition, or die due to complex biological pathways such as necrosis or apoptosis.
Regardless of the cause, these cytotoxic substances frequently impair cell membrane integrity, and once a cell loses this, the cell cannot survive.
Apoptosis causes morphological changes such as pseudopodia retraction, cellular volume reduction (pyknosis), nuclear fragmentation (karyorrhexis), and, eventually, loss of plasma membrane integrity.1 Necrotic morphological alterations include cytoplasmic enlargement and early plasma membrane rupture.2
In vitro cytotoxicity assays are used to predict tissue-specific toxicity or to identify and classify anticancer therapy leads. Multiplexed, high-throughput screening (HTS) cytotoxicity assays measure a range of readouts to evaluate the cytotoxicity of compounds in early drug development. Cell-based studies can be used to evaluate biocompatibility with medical devices throughout the early stages of R&D.3
Common cytotoxicity assays include a variety of end-point metabolic activity measurements, such as the release of lactate dehydrogenase (LDH) and glutathione (GSH) after membrane rupture, the generation of reactive oxygen species (ROS), cell proliferation, and disruption of mitochondrial transmembrane potential.
Additionally, numerous cytotoxicity assays measure membrane integrity, such as the use of propidium iodide and other important dyes in flow cytometry or fluorescence microscopy.4 Chemical concentration, as well as the time given for the chemical to elicit an effect, are key considerations in the predictive nature of these tests.5
Although these multiplexed assays can evaluate numerous indications of in vitro cytotoxicity simultaneously, they typically examine just one point and cannot assess biological activity over time.
Live-cell analysis approaches have been developed to test cell membrane integrity in a kinetic manner. Optimized technology and reagents are needed to obtain flexible and accurate evaluation.
This article discusses the use of Incucyte® Cytotoxicity Assays, which use no-wash, mix-and-read chemicals as well as integrated image-based analysis tools for kinetic cytotoxicity quantification.
Assay principle
The Incucyte® Cytotoxicity Assay uses the Incucyte® Cytotox Dyes and the Incucyte® Live-Cell Analysis System to evaluate cell death in real time, in response to pharmacological drugs or environmental variables, depending on cell membrane integrity.
Incucyte® Cytotox Dyes are very sensitive nucleic acid dyes. The addition of Incucyte® Cytotox Dye to normal healthy cells does not affect cell growth or shape and produces little or no intrinsic fluorescence signal.
When cells become sick, the integrity of their plasma membrane deteriorates, allowing Incucyte® Cytotox Dye to enter and produce a 100- to 1,000-fold increase when bound to deoxyribonucleic acid (DNA) (Figure 1).
Fluorescently tagged green, red, or near infrared (NIR) nuclei make dying cells detectable, and they can be counted over time. The Incucyte® integrated analytic program can automatically quantify fluorescent objects while minimizing background fluorescence.
Incucyte® HD phase contrast images and movies also validate cell death based on morphology (for example, loss of cytoskeleton structure and motility).
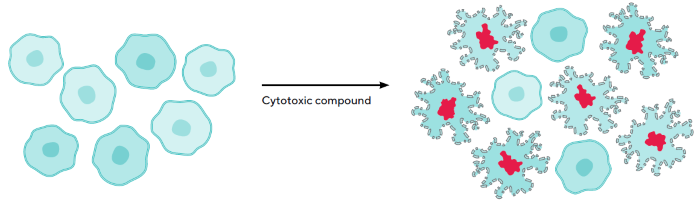
Figure 1. Schematic Demonstrating Assay Principle of Live-Cell Incucyte® Cytotoxicity Assay. Image Credit: Sartorius
Note. Nuclear staining indicates loss of membrane integrity, a hallmark of cell death. The cell impermeable DNA stain, Incucyte® Cytotox, stains cell nuclei only when cells have lost membrane integrity following treatment with a cytotoxic compound. Hallmarks of necrotic cell death include cytoplasmic swelling and loss of membrane integrity. Viable cells remain unstained, and their growth unperturbed, in the presence of Incucyte® Cytotox Dyes.
Materials and methods
Figure 2 shows how the Incucyte® Cytotoxicity Assay uses a simple mix-and-read methodology in a high-throughput format to produce a highly adaptable assay. It can be used with any cell type, including adherent or non-adherent cells, and allows for the non-invasive assessment of treatment effects in real time.
The pre-aliquoted Incucyte® Cytotox Dyes can be used in conjunction with the Incucyte® confluence metric, Incucyte® Nuclight Reagents for nuclear labeling, Incucyte® Annexin V Dyes, or Incucyte® Caspase-3/7 Dyes to quantify cytotoxicity, cell proliferation, and apoptosis.
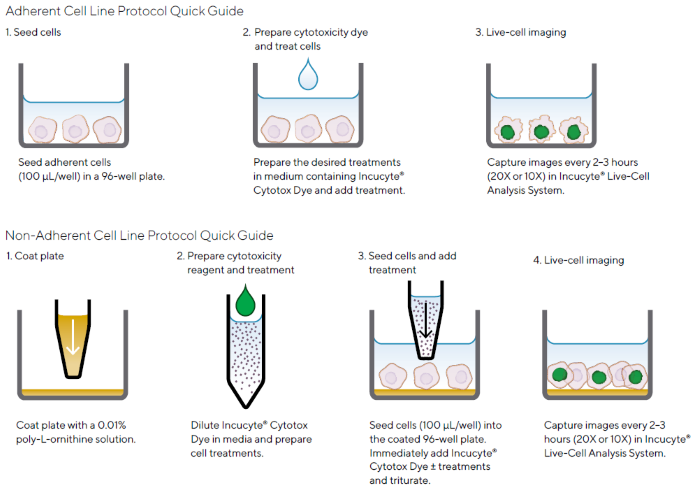
Figure 2. Quick Guide of Incucyte® Cytotoxicity Assay Protocols for Adherent or Non-Adherent Cells. Image Credit: Sartorius
Note. The simple protocols use Incucyte® Cytotox Dyes and the Incucyte® Live-Cell Analysis System for image-based fluorescent measurements of cytotoxicity.
Validation data
Quantification of cytotoxicity
The Incucyte® Live-Cell Analysis System, when combined with Incucyte® Cytotox Dyes, allows cytotoxicity to be visualized and quantified.
The integrated image-based analytic tools help automatically segment nuclear fluorescence throughout the test time course while minimizing the impact of background fluorescence.
Figure 3 shows how the cytotoxic response of Jurkat (a non-adherent lymphoblastic leukemia cell line) to anti-cancer medication Camptothecin (CMP) can be measured kinetically. Jurkat cells were exposed to 3 µM CMP in the presence of Incucyte® Cytotox NIR dye.
The phase-contrast and blended fluorescence pictures obtained (NIR pseudo-colored blue) are shown in Figure 3, together with the fluorescence segmentation mask (red) that was used to estimate cytotoxicity after treatment.
The Cytotox NIR Dye increased nucleic acid binding over 24 hours. Images enabled the linkage of membrane integrity with morphological changes associated with cytotoxicity, evidenced by the typical 'halo' effect seen with Jurkat cell death.
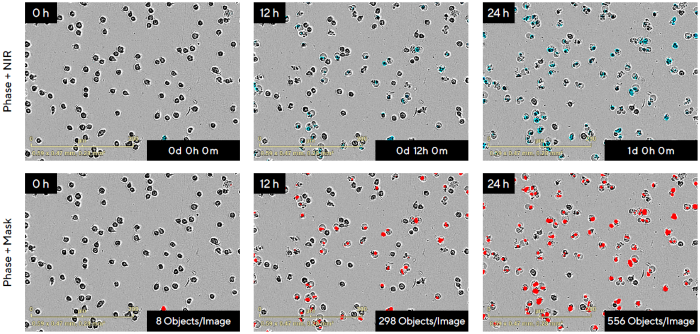
Figure 3. Real-Time Visualization and Quantification of Non-Adherent Jurkat Cell Death in Response to the Anti-Cancer Drug Camptothecin (CMP) Using the Incucyte® Live-Cell Analysis System. Image Credit: Sartorius
Note. Jurkat cells (20,000 cells/well) were treated with 3 μM CMP in the presence of Incucyte® Cytotox NIR Dye. Images were acquired every 2 h at 20X for the duration of the experiment. Representative phase-contrast and blended fluorescence images (NIR pseudo-colored blue; top row) and the segmentation mask generated using Incucyte® integrated image analysis tools (red; bottom row) are shown over time (0–24 h). Observe increase of nucleic acid binding by Incucyte® Cytotox NIR Dye as measured by NIR Object Count (8 at 0 h vs. 556 Objects/Image at 24 h). The fluorescent signal from the Incucyte® Cytotox Dyes can be correlated with morphological changes associated with cell death.
This method can be used to quantitatively investigate cytotoxicity in a high-throughput setting. To test this, the Incucyte® Cytotoxicity Assay was used to assess the cytotoxic response of HT-1080 fibrosarcoma cells to four distinct drugs.
Cells were seeded and treated with twofold decreasing doses of each chemical in the presence of Incucyte® Cytotox Green Dye, and the fluorescence data was evaluated using integrated software (Figure 4).
The microplate view indicates a kinetic change in fluorescence for all wells over 72 hours, with varied patterns for each treatment (Figure 4A). Camptothecin (CMP) was highly cytotoxic at all concentrations examined, but Cisplatin (CIS), Staurosporine (SSP), and Nocodazole (NOC) had concentration-dependent effects.
Cisplatin, an alkylating drug, is a well-known chemotherapy treatment for various malignancies. It cross-links with DNA, triggering DNA damage pathways and eventually leading to apoptosis.6,7
The kinetic cytotoxic response of HT-1080 cells to CIS treatment is shown below. Subsequent quantification revealed a concentration-dependent impact at 48 hours (Figure 4B).
In control settings, there was little to no increase in fluorescence compared to Cisplatin (3.17 ± 0.83 green objects per image for vehicle vs. 214.93 ± 7.61 for 50 µM Cisplatin after 48 hours).
These results show that the Incucyte® Cytotoxicity Assay is useful for visualizing and quantifying cytotoxicity, as well as how live-cell analysis lends itself to high-throughput pharmacological inquiry.
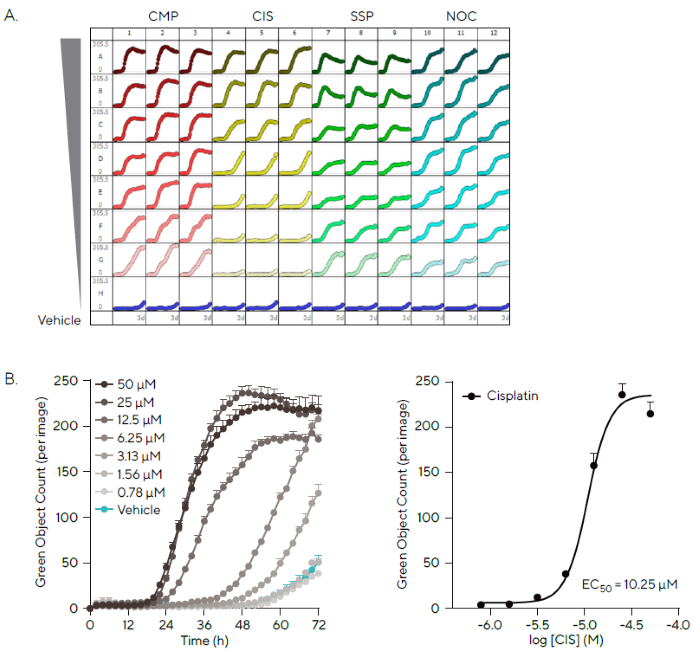
Figure 4. Automatic Analysis of Cytotoxicity in a High-Throughput Manner. Image Credit: Sartorius
Note. HT-1080 fibrosarcoma (2,000 cells/well) were seeded and after 18 h treated with four compounds in the presence of Incucyte® Cytotox Green Dye. (A) Incucyte® Cytotoxicity Assay allows every well of a 96/384-well plate to be imaged and analyzed automatically to provide a microplate readout of cytotoxicity over time. Microplate view shows kinetic change in green fluorescence following treatment with varying profiles over 72 h. (B) Timecourse and concentration-response curve at 48 h show the concentration-dependent cytotoxic effect of Cisplatin (CIS; 50–0.78 μM) on HT-1080 cells as measured by Green Object Count. Data presented as Mean ± SEM, n = 3.
Profiling single compounds across multiple cancer cell types
Camptothecin is a cytotoxic chemical commonly used in research to induce cell death by blocking the DNA enzyme topoisomerase I (TOPO I), resulting in double-strand breaks during S-phase and activating the apoptotic pathway.8
In a pharmacological study, CMP was used to demonstrate the Incucyte® Cytotoxicity Assay's ability to assess cytotoxicity over time in three different cancer cell lines: A549 (human tumor-derived pulmonary adenocarcinoma), SKOV3 (human tumor-derived ovarian carcinoma), and MDA-MB-231 (human tumor-derived breast fibrosarcoma).
Figure 5A shows the phase contrast and blended fluorescent pictures of 1.25 µM CMP treatment or vehicle for each cell type, highlighting morphological alterations and Cytotox fluorescence associated with CMP-induced cell death after 72 hours.
The quantification of cytotoxicity over time demonstrated that CMP had distinct effects on each cancer cell line, with A549 cells displaying the most cytotoxic response and SKOV3 and MDA-MB-231 showing lower levels of fluorescence (Figure 5B).
Further analysis enables direct comparison of cytotoxicity, as demonstrated by concentration-response curves at 72 hours and estimated EC50 values (Figure 5C).
These experimental results back up the already known lethal effects of CMP, show the diverse sensitivity of cancer cell lines, and provide a strong live-cell assay for researching novel cancer therapeutics.
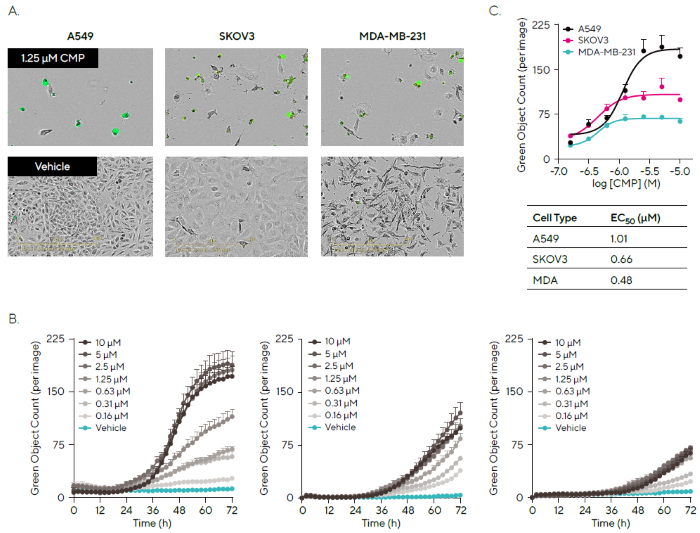
Figure 5. Profiling Treatment Effects in Different Cancer Cell Lines. Image Credit: Sartorius
Note. Cells were seeded (2,000 cells/well), and after 18 h, treated with a concentration range of Camptothecin (CMP; 10–0.16 μM) in the presence of Incucyte® Cytotox Green Dye. (A) Phase and fluorescence images (72 h; 20X) show Cytotox fluorescence and morphological changes for CMP (1.25 μM) treated cells (top image) compared to vehicle (bottom image) for three cancer cell types, A549, SKOV3, and MDA-MB-231. (B) Time courses show differential kinetic profiles of cytotoxic response to CMP as measured by Green Object Count. (C) Transformation of data into concentration-response curves (72 h) enables comparison of pharmacology across the cell lines. Data presented as Mean ± SEM, n = 3.
Multiplexed measurements of proliferation and cytotoxicity
Using the Incucyte® Live-Cell Analysis System, Incucyte® Cytotox Dyes can be paired with Incucyte® Nuclight Reagents for nuclear labeling to perform multiplexed experiments that can measure both cytotoxicity and proliferation.
To demonstrate this, Incucyte® Nuclight Red HT-1080 fibrosarcoma cells were exposed to serially diluted CMP concentrations in the presence of Incucyte® Cytotox Green Dye (Figure 6).
Representative time-lapse photos show that Incucyte® Cytotox Green Dye reduces red nuclear fluorescence and increases nucleic acid binding after CMP treatment. To quantify cell mortality, the green fluorescent signal was masked using Incucyte® integrated analytic software, as was the red fluorescent nuclear signal to measure cell growth.
CMP demonstrated a concentration-dependent negative connection between cell growth and cytotoxicity, with identical IC50 and EC50 values (0.11 µM and 0.49 µM, respectively). These findings demonstrate the possibility of a kinetic and multi-parametric approach to chemical classification in drug discovery.
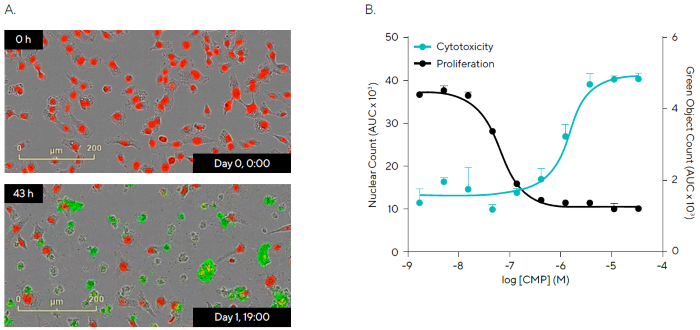
Figure 6. Multiplexed Cytotoxicity Measurements and Live-Cell Counting for Assessment of Compound Effects. Image Credit: Sartorius
Note. HT-1080 fibrosarcoma cells pre-labeled with Incucyte® Nuclight Red Lentivirus (5,000 cells/well) were treated with Camptothecin (CMP; 33.3–0.001 μM) in the presence of Incucyte® Cytotox Green Dye to detect live and dead cells over time. (A) Images show a decrease in Nuclight Red signal and an increase in Cytotox Green fluorescence following CMP (0.15 μM) addition (0 h vs. 43 h). (B) Statistical analysis of the area under the curve (AUC; 0–48 h) revealed a concentration-dependent decrease in proliferation (Red Nuclear count) and concomitant increase in cytotoxicity (Cytotox Green object count) over 48 h (IC50 = 0.11 μM and EC50 = 0.49 μM, respectively). Data presented as Mean ± SEM, n=3.
Subpopulation analysis of cytotoxic and cytostatic treatment effects
The Incucyte® Cell-by-Cell Analysis Software Module allows for the segmentation of individual cells in a phase-contrast image, as well as the extraction of fluorescence metrics per cell inside the segmented boundary. The integrated analytic program can classify cell types based on fluorescence characteristics.
To demonstrate this, label-free counting (proliferation) and Cytotox Dye fluorescence classification (cytotoxicity) were used to examine the effects of two drugs with distinct modes of action on the total cell population (Figure 7).
Camptothecin (CMP), a DNA synthesis inhibitor, is a cytotoxic chemical thought to cause cell death. Cycloheximide (CHX), a protein synthesis inhibitor, is a cytostatic drug that was expected to reduce cell growth while not impacting cell viability.
HT-1080 fibrosarcoma cells were treated with these two chemicals (10-0.004 µM) with Incucyte® Cytotox Green Dye.
Cell subsets were identified based on green fluorescence using Cell-by-Cell Analysis Software, and representative phase and blended fluorescent images for each chemical show how cells are classified as live or dead (the dead (green) cells are hidden).
The classification plots for identifying the dead population are also provided. Label-free counting and the computation of the cytotoxic index, reported as a percentage of dead cells over the total number of cells using the Incucyte® software, revealed that the two drugs had different impacts on proliferation and cytotoxicity.
CMP promoted HT-1080 cell death in a concentration-dependent manner, indicating a cytotoxic mechanism of action. There was no significant increase in cytotoxicity for CHX.
A definite concentration-dependent reduction of cell growth was detected, suggesting a cytostatic action mechanism. Overall, these findings demonstrate the potential of this dynamic approach to provide insight into drug-induced therapeutic effects, specifically by investigating mechanisms of action based on subpopulation studies of cell health.
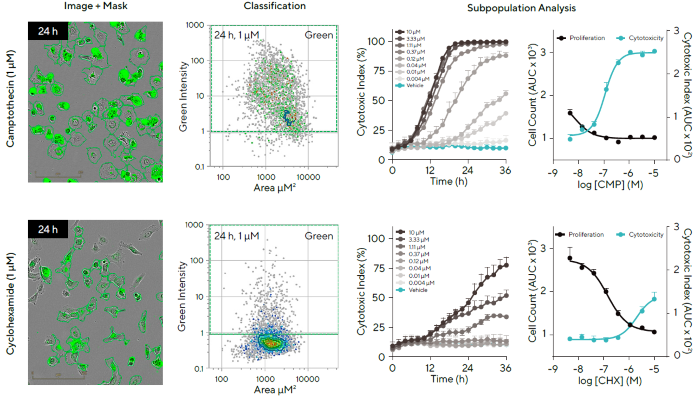
Figure 7. Investigation of Drug Mechanisms of Action in Subpopulations of Cells Using Live-Cell Label Free Counting and Cytotox Readouts. Image Credit: Sartorius
Note. HT-1080 fibrosarcoma cells (5,000 cells/well) were treated with Camptothecin (CMP; Cytotoxic) or Cycloheximide (CHX; Cytostatic) in the presence of the Incucyte® Cytotox Green Dye. Phase and fluorescent images illustrate how Cell-by-Cell Analysis can be utilized to detect live/dead cells at 24 h (masking of dead cells shown). Classification plots to identify green (dead) population (second column), time-course graphs (third column), and concentration-response curves (fourth column) show a difference in the effect of a cytotoxic and cytostatic compound. Data presented as Mean ± SEM, n = 3.
Summary and outlook
Cell death is a dynamic process; hence, monitoring cell cytotoxicity is essential in many therapeutic fields, particularly cancer treatment.
The use of the Incucyte® Live-Cell Analysis System in conjunction with Incucyte® Cytotox Dyes as a live-cell kinetic assay for cytotoxicity assessment has resulted in the quantitative and repeatable detection of cell permeability, a marker of cell death.
This technique also allows for simultaneous monitoring of morphological changes and measurements in physiologically relevant situations. Incucyte® Cytotox Dyes can be used with Incucyte® Nuclight Reagents or cell lines to perform multiplexed proliferation and cytotoxicity studies.
Incucyte® Cell-by-Cell Analysis Software offers fluorescence-based individual cell segmentation and classification, allowing for the calculation of additional parameters such as the cytotoxic or apoptotic index and the assessment of drug mechanisms of action on cell populations.
Overall, the Incucyte® Cytotoxicity test is a robust and adaptable instrument that allows for pharmacological investigations across a variety of test formats (Table 1) and provides greater insight into the temporal patterns of cell death.
Table 1. Incucyte® Dyes for Live-Cell Imaging and Analysis of Cell Health. Source: Sartorius
|
Incucyte®
Cytotox Dye |
Incucyte®
Annexin V Dye |
Incucyte®
Caspase-3/7 Dye |
| Cell viability |
 |
|
|
| Apoptosis |
|
|
|
| 2D Monolayer + multiplex |
|
|
|
| 3D Single spheroid |
|
|
|
| 3D Multi-spheroid + multiplex |
|
|
|
| Fluorescence channels |
Red, green,
near-IR |
Red, green,
orange, near-IR |
Red, green,
orange* |
*Incucyte® Metabolism
Note. Table summarizes Incucyte® Dyes validated for investigation of cell health using the Incucyte® Live-Cell Analysis System across a range of assay formats.
References
- Kepp, O., et al. (2011). Cell death assays for drug discovery. Nature Reviews Drug Discovery, 10(3), pp.221–237. https://doi.org/10.1038/nrd3373.
- Kroemer, G., et al. (2008). Classification of cell death: recommendations of the Nomenclature Committee on Cell Death 2009. Cell Death & Differentiation, (online) 16(1), pp.3–11. https://doi.org/10.1038/cdd.2008.150.
- Abraham, V.C., et al. (2008). Application of a High-Content Multiparameter Cytotoxicity Assay to Prioritize Compounds Based on Toxicity Potential in Humans. Journal of Biomolecular Screening, 13(6), pp.527–537. https://doi.org/10.1177/1087057108318428.
- Becker, B., et al. (2002). In Situ Screening Assay for Cell Viability Using a Dimeric Cyanine Nucleic Acid Stain. Analytical Biochemistry, (online) 221(1), pp.78–84. https://doi.org/10.1006/abio.1994.1382.
- Abassi, Y.A., et al. (2009). Kinetic Cell-Based Morphological Screening: Prediction of Mechanism of Compound Action and Off-Target Effects. Chemistry & Biology, 16(7), pp.712–723. https://doi.org/10.1016/j.chembiol.2009.05.011.
- Tanida, S., et al. (2012). Mechanisms of Cisplatin-Induced Apoptosis and of Cisplatin Sensitivity: Potential of BIN1 to Act as a Potent Predictor of Cisplatin Sensitivity in Gastric Cancer Treatment. International Journal of Surgical Oncology, (online) 2012, pp.1–8. https://doi.org/10.1155/2012/862879.
- Dasari, S. and Tchounwou, P.B. (2014). Cisplatin in Cancer therapy: Molecular Mechanisms of Action. European Journal of Pharmacology, 740(1), pp.364–378. https://doi.org/10.1016/j.ejphar.2014.07.025.
- Ulukan, H. and Swaan, P.W. (2002). Camptothecins. Drugs, 62(14), pp.2039–2057. https://doi.org/10.2165/00003495-200262140-00004.
About Sartorius
Sartorius is a leading international pharmaceutical and laboratory equipment supplier. With our innovative products and services, we are helping our customers across the entire globe to implement their complex and quality-critical biomanufacturing and laboratory processes reliably and economically.
The Group companies are united under the roof of Sartorius AG, which is listed on the Frankfurt Stock Exchange and holds the majority stake in Sartorius Stedim Biotech S.A. Quoted on the Paris Stock Exchange, this subgroup is comprised mainly of the Bioprocess Solutions Division.
Innovative technologies enable medical progress
A growing number of medications are biopharmaceuticals. These are produced using living cells in complex, lengthy and expensive procedures. The Bioprocess Solutions Division provides the essential products and technologies to accomplish this.
In fact, Sartorius has been pioneering and setting the standards for single-use products that are currently used throughout all biopharmaceutical manufacturing processes.
Making lab life easier
Lab work is complex and demanding: Despite repetitive analytical routines, lab staff must perform each step in a highly concentrated and careful way for accurate results.
The Lab Products and Services Division helps lab personnel excel because its products, such as laboratory balances, pipettes, and lab consumables, minimize human error, simplify workflows, and reduce physical workloads.
Sponsored Content Policy: News-Medical.net publishes articles and related content that may be derived from sources where we have existing commercial relationships, provided such content adds value to the core editorial ethos of News-Medical.Net which is to educate and inform site visitors interested in medical research, science, medical devices and treatments.