Introduction
Cell migration is a basic constituent of various pathological and biological processes, such as tissue re-organization, embryonic development, angiogenesis, tumor metastasis, immune cell trafficking, and chronic inflammation.
It is also a multistep process, which is started by a stimulus, triggering a group of signaling pathways and promoting cellular polarization as well as a quick rearrangement of microtubules and actin filaments.
Cells typically develop by projecting their membrane at their cell border, followed by dynamic binding of the substrate through the adherence of integrin to the substrate.
The cycle is completed by retraction of the membrane at the lagging edge of the cell, and the cycle is subsequently repeated in quick succession. This process summation leads to cell migration.
Another multistep process metastasis is controlled by genetic and epigenetic factors, hormones, and growth factors, which, in turn, modify the phenotypic properties of cancer cells.
Metastasis is considerably contributed by cellular invasion. The conversion from a benign phenotype to a metastatic one could allow a cancer cell to attack and remodel its microenvironment3.
The ability of a cell to change and rearrange its cellular morphology determines the ability of cancer cells to form a metastatic tumor, and to deteriorate the extracellular matrix (ECM). Secondary tumor is formed with the help of these features. Table 1 lists the primary steps involved in the formation of a metastatic tumor.
Table 1. Metastatic Tumor Formation
|
Detachment of cells from the primary tumor
|
|
Invasion of cancer through the basement membrane and into blood vessels (Intravasation)
|
|
Survival in the circulation
|
|
Attachment to vascular endothelium
|
|
Exit of tumor cells from a capillary and entry into a new organ (Extravasation)
|
|
Tumor formation in a new organ
|
A continuous, thin sheet of extracellular matrix forms as a basement membrane. This membrane surrounds the organs and serves as a barrier to tumor cells4.
A key component of the ECM is Type I collagen, a biomatrix material that represents a major barrier to cancer cells invading into the surrounding organ tissue and vascular and lymph networks. In the majority of cases, tumor cells spread through the degradation of collagen 1.
This article shows how the Migration Assay is used as a starting point for producing a kinetic, flexible, and quantitative 3D cell invasion Assay and also for investigating the 2D cellular migration potential in the presence of experimental agents.
The 96-well WoundMaker™ is employed in both the Invasion and Migration Assays to create a cell-free zone in the cells’ monolayer. Both the Invasion and Migration are highly reproducible and label-free assays.
Cells from each well of a 96-well microplate are removed using precision engineered pins, without causing any damage to the biomatrix coating applied to the assay microplate wells. Migration Assays can be performed on non-coated plastic treated with tissue culture.
As soon as wounding is completed, the cells are overlaid with an optimized biomatrix material concentration to initiate the Invasion Assay, while media is simply added to the cells to initiate the cell Migration Assay (Figure 1).
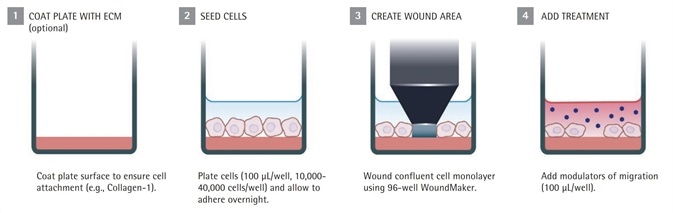
Figure 1a. IncuCyte® live-cell analysis migration assay protocol
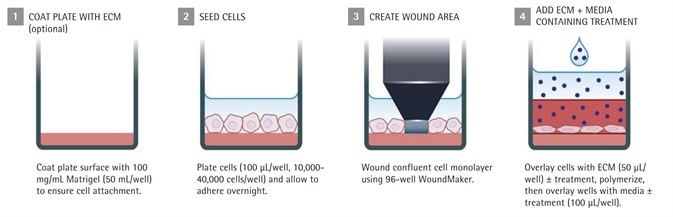
Figure 1b. IncuCyte® live-cell analysis invasion assay protocol
In both cases, the IncuCyte® automatically obtains the images for the whole period of the assay. After completing the assay, the integrated software of the IncuCyte® is used to measure migration and invasion of cells.
Both the Invasion and Migration Assays have the ability to establish whether the effect of a genetic manipulation and pharmacological agent is specific or not.
Experimental methods
Cells were grown in a traditional CO2 incubator to confluence in a 96-well Sartorius ImageLock™ plate before beginning a 96-well assay. In the case of Migration Assays, the wells are either coated with a biomatrix material or left uncoated to ensure that cells bind tightly to the well.
With regard to the Invasion Assays, the plate’s wells are coated with biomatrix material so that the 3D gel layer adheres tightly. This set up produces the tissue-like environment required for invasion. The Sartorius ImageLock plates are used to ensure that the IncuCyte™ software automatically detects and registers the wounds.
At the same time, the 96-pin WoundMaker™ uses a series of 96 pins to remove the cells from the confluent monolayer, and produces reproducible and precise wounds in all the wells of a 96-well ImageLock plate. As soon as the plate is mounted into the WoundMaker, 96 precise wounds are made rapidly following the comprehensive protocol of Sartorius.
For Migration Assays: media comprising the suitable agents was washed and added to the plate, which was loaded into the IncuCyte®.
For Invasion Assays: The ImageLock plate was washed and loaded onto a pre-chilled CoolBox 96F microplate rack (Biocision) and equilibrated for 5 minutes. Each well of the 96-well microplate was added with 50 to 70μl/well of an optimized concentration of biomatrix material.
After testing the pharmacological agents, each was brought to its final concentration in the gel layer after dilution. This was followed by incubating the microplate on a CoolSink 96F microplate rack, which was prewarmed for 30 minutes in a 37°C CO2 incubator to enable the biomatrix material to gel.
Next, the microplate was superimposed with an equal quantity of complete medium that contains the pharmacological agents being tested.
Prior to the first scan, assay plates were allowed to equilibrate inside the IncuCyte™ for at least 15 minutes. The software was configured to scan the experiment every two to three hours for invasion Assays and every one hour for Migration Assays by using “Scratch Wound” as the “Experiment Type”.
One of three integrated metrics (wound confluence, wound width, or relative wound density) was used for analyzing the data for Migration Assays. Custom algorithms, which are part of the IncuCyte™ package, were used to determine these metrics.
The algorithms are user-informed, detect the wound area, and give visual representations of the segmentation parameters, as shown in Figure 2. Relative Wound Density (RWD) algorithm was employed to report the data for the Invasion Assay, since it is the only metric qualified by Sartorius to determine the cell invasion.
Three to five representative phase contrast images were used to produce an image collection for processing. Experimental data was studied using a Processing Definition, specific to cell type.
After exporting the data, GraphPad Prism was used to complete further graphing and statistics. At each and every time point, morphological features were reviewed and time-lapse movies were produced to monitor the activity of cells over the period of the assay.
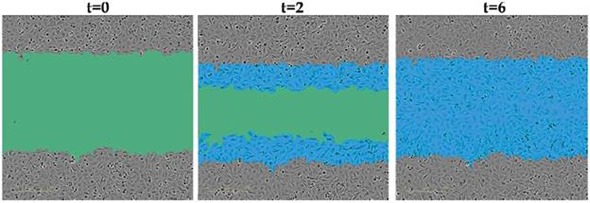
Figure 2. Quantifying Cell Migration and Invasion.The green region denotes the scratch wound mask over time (t=0, t=2 hours) as HT-1080 cells migrate into the wound region. The initial scratch wound mask, created immediately following wound creation, is shown in blue. Complete wound closure is observed at t=6 hours.
Quantitation methods
Three separate metrics are used by the IncuCyte® software package to measure the migration of cells over time. Wound width is the first metric. In certain situations, during cell migration, the formation of new boundaries remains quite parallel to each other.
In such a case, changes in wound width exactly report the extent and duration of cell migration. Wound confluence is the second metric, which is a report of cell confluence in the wound area. RWD is the third metric, which is the only Sartorius-qualified metric used for measuring the Invasion Assay.
RWD depends on quantifying the spatial cell density in the wound region with respect to the spatial cell density beyond the wound region at each time point. At t=0, RWD is designed to be zero, and 100% when the cell density outside the initial wound and the cell density inside the wound is the same.
The metric, in this regard, is self-normalizing for cell density changes, which can take place outside the wound due to pharmacological effects or proliferation of cells. The RWD serves as a powerful metric across various types of cells since it does not depend on locating cell boundaries.
Performance of 96-well WoundMaker™
The ability to make precise wounds is a major factor for building precision into the Invasion and Migration Assays. The kinetics of wound closure, for example, the duration of time till compete closure, relies on the first wound width.
Complete closure takes longer in larger wounds and changes in wound size can change the slope and time course of wound closure metrics. As a result, data can be interpreted more easily in the case of consistent wounds.
In addition, consistent wound size ensures that the wound region is accommodated within a specified image field-of-view (Figure 3). This is important for assay automation.
As mentioned before, the complicated mechanisms, which promote cell migration, are partly driven by interactions between cells. This biology is made more consistent with reproducible wounds regions, thus aiding in precision and interpretation of assays.
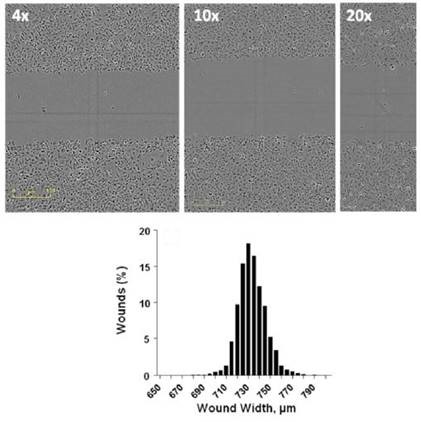
Figure 3. Formation of Precise Wounds using the Sartorius WoundMaker™.Top) Representative images from wounds made using a confluent monolayer of HT-1080 cells at 4x, 10x, and 20x objectives, imaged using IncuCyte®. Bottom) Histogram of 960 individual wounds compiled from 10 independent WoundMakers on 10 different 96-well ImageLock™ plates of HT-1080 cells.
Figure 4 shows the variations in cell morphology and wound closure rates between invading and migrating HT-1080 cells. The wound area was closed by migrating HT-1080 cells at a much faster rate, and complete wound closure was detected after 10 to 12 hours post wounding.
On the contrary, HT-1080 cells invading 8mg/ml Matrigel® were able to reach 80% wound closure within 48 hours as determined by the RWD metric. Morphological variations were also observed. A fibroblastic morphology, sustained by migrating cells, exhibited rounded lamellipodia, and progressed as a homogeneous cell population.
A mesenchymal phenotype showing extended cell bodies, and in certain cases “spike-like” lamellipodia, was adopted by the invading HT-1080 cells, as the cells progressed into the Matrigel® matrix in an asymmetrical way. The optimum condition for the Invasion Assay can be chosen by using the apparent morphological differences between invading and migrating HT-1080 cells.
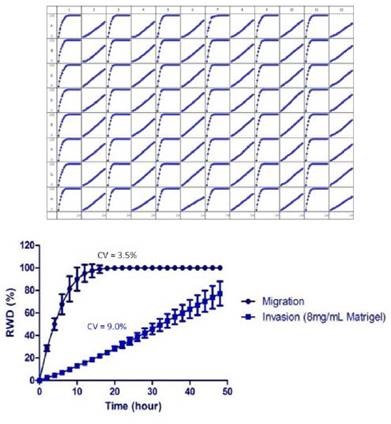
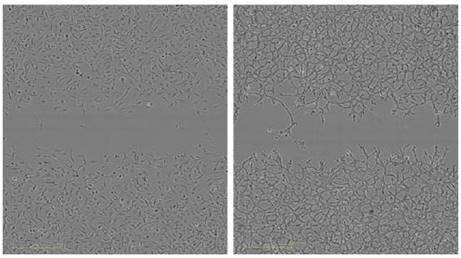
Figure 4 (Left). Measurement of the reproducibility the migration and Invasion Assay in the same microplate. HT-1080 cells were plated at 2 x 10⁴ cells per well on 100μg/ml Matrigel® coated ImageLock™ plates. The cells in odd numbered columns had only media added after using the 96-well WoundMaker™ representing cell migration. The cells in even numbered columns were overlaid with 8mg/ml Matrigel® representing invasion. Top) Temporal progression of wound closure in each well with time using RWD as the metric to measure migration or invasion. Middle) Time course of means of each condition. The respective coefficients of variation for each assay were averaged. Bottom) Representative images of HT-1080 cells migrating on Matrigel® (left) and invading through 8mg/mL.
Differentiating between invasive and non-invasive cells
MCF-7 cells are relatively non-invasive (7), while HT-1080 and MDA-MB-231 cells are highly invasive cells types (6). These cell types were examined in both Migration and Invasion Assays (Figure 5).
As demonstrated earlier, HT-1080 cells initially migrated on collagen 1-coated plates and then invaded the 3D collagen 1, with the invasion rate slowing down while simultaneously increasing the concentration of collagen 1 matrix from 1 to 3mg/ml.
Though the MDA-MB-231 cells also migrated on collagen 1-coated plates, they invaded 3D collagen more gradually when compared to the HT-1080 cells. It was also observed that the invasion rate of MDA-MB-231 cells was comparable at all concentrations of 3D collagen 1 tested.
Similar to the other two cells types, MCF-7 cells migrated on collagen 1-coated plates yet when compared to the other two cells types, they lacked the ability to invade 3D collagen 1 at the tested concentrations.
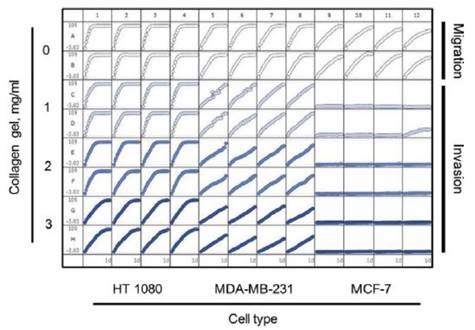
Figure 5. 96-well microplate graph of three cell types in the cell migration and Invasion Assay. All wells were coated with 300μg/ml collagen 1. HT-1080 (2 x 10⁴ cells per well) are in column 1-4, MDA-MB-231 (2.5 x 10⁴ cells per well) are in column 5-8 and MCF-7 (5 x 10⁴ cells per well) are in column 9-12. Rows A and B show the cell migration data for the three cell types. The same cells in the Invasion Assay are shown in rows C-D (1mg/ml 3D collagen 1), rows D-E (2mg/ml 3D collagen 1) and rows G-H (3mg/ml 3D collagen 1). The plate map graph shows the progression of each well with time using the RWD metric to measure migration or invasion.
Pharmacology experiment using the Sartorius cell Migration and Invasion Assays
Pharmacological agent blebbistatin prevents myosin by attaching to the ATPase intermediate with phosphate and ADP adhered at the active site. This slows down the discharge of phosphate and prevents cell locomotion8.
Studies performed in the past indicated that blebbistatin can inhibit 3D cell invasion more effectively as opposed to 2D cell migration9.The CellPlayer 96-well format makes it easy to design an experiment to simultaneously determine invasion and migration in the same microplate. Leveraging this method, HT-1080 cells were used to study the effect of blebbistatin on invasion and migration.
Figure 6A shows the plate map, which reveals an easy way for experimental setup. Six columns of cells were used – three for invasion and three for migration. This was followed by performing a 7-point concentration curve of blebbistatin, as shown in rows A-G.
For solvent control, Row H was employed. Figure 6B shows the microplate graph, which depicts the assay reproducibility and shows the effect of each drug concentration in both assay formats. Upon analysis, blebbistatin seemed to have a greater effect on invasion than that of migration.
When data was plotted as the average of the treatment group for invasion and migration, blebbistatin was found to have a much greater effect on invasion, as respectively shown in Figure 6C and D.
The concentration response analysis at the 24-hour time point for both type of assays is shown in Figure 6E. Based on these data, the quantified IC50 of blebbistatin for invasion and migration is 5.2 and 92μM, respectively. The Z’ is 0.77 for this data set.
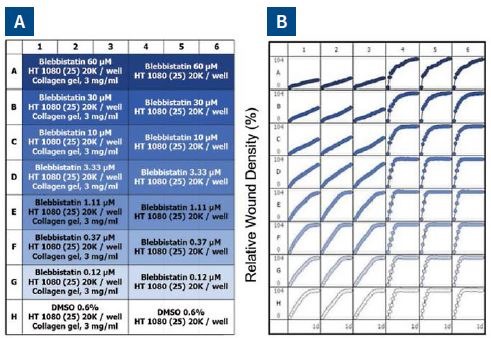
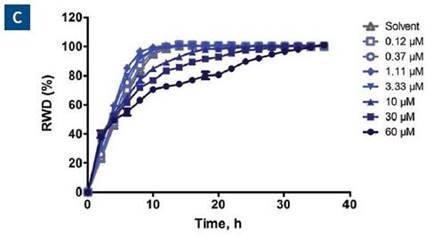
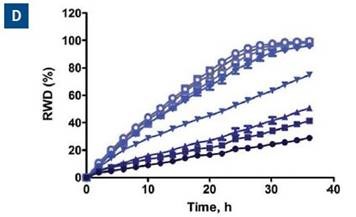
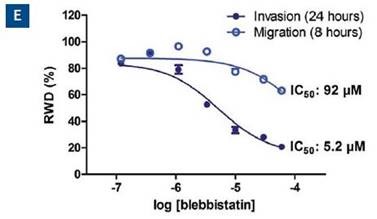
Figure 6. Effect of blebbistatin on the migration and invasion of HT-1080 cells. All wells were coated with 300μg/ml collagen 1. HT-1080 (2 x 10⁴ ceHT-1080 cells were plated at 2 x 10⁴ cells per well on 300μg/ml collagen 1 coated plates. Panel A shows the plate map for the experiment. The cells in columns 1-3 were overlaid with 3mg/ml 3D collagen 1 containing blebbistatin or solvent control. The cells in columns 4-6 were given complete growth media with blebbistatin or the solvent control. Panel B shows the microplate graph of the experiment. Panel C and D show the means of each treatment group for migration and invasion, respectively. Panel E shows the concentration response analysis of blebbistatin on cell migration and invasion. The IC50 calculation for each assay is included next to the concentration response curve.
Zinc-dependent endopeptidases such as matrix metalloproteinases (MMPs) degrade basement membrane materials, including collagen 1. A large number of cells derived from highly metastatic tumors express these MMPs at increased levels.
A broad MMP inhibitor GM6001 prevents the entry of HT-1080 cells into collagen 15. The CellPlayer 96-well Migration and Invasion Assay was configured to test how this drug affects migration and invasion on the same microplate.
It was found that GM6001 does not have any effect on HT-1080 cell migration, as shown in Figure 7A; however, it inhibited the invasion into collagen 1 in a concentration-dependent way (Figure 7B). When a protease cocktail containing leupeptin (2μM), E-64 (25μM) pepstatin A (100μM), and aportinin (2μM) was added, there was no measurable effect on cell invasion or cell migration.
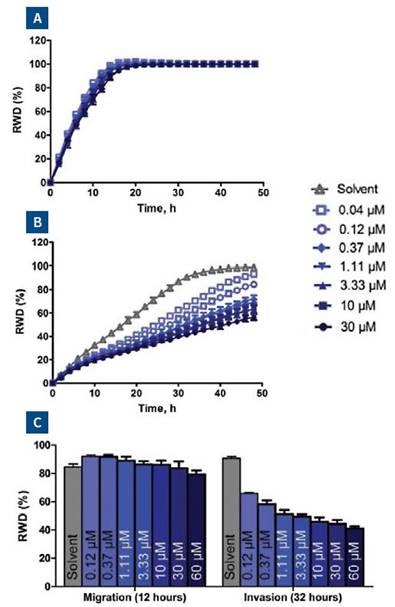
Figure 7. HT-1080 cells were plated at 2 x 10⁴ cells per well on 300μg/ml collagen 1 coated plates. The GM6001 concentration response was carried out as described for blebbistatin experiment described in Figure 6. Panel A and B show the means of each treatment group for migration and invasion, respectively. Panel C shows the effect of GM6001 on cell migration and invasion in a bar chart format at the 32-hour time point.
Two-color fluorescent scratch wound experiments
The IncuCyte® allows users to acquire two-color images as well as phase contrast images in the Scratch Wound mode. Combined with the Sartorius CellPlayer™ fluorescent protein reagents, the interactions between different types of cells in a mixed culture can now be addressed, and how each cell affects proliferation, invasion, and migration of the other within a single well of a 96-well plate.
The HT-1080 cells and non-invasive MCF-7 cells were labeled with NucLight Red and NucLight Green, respectively, and then combined in co-culture and plated for an Invasion Assay via 8mg/ml Matrigel® (Figure 8). Imaging in phase, green, and red channels showed that the MCF-7 cells remained non-invasive, while the HT-1080 cells invaded the Matrigel® matrix efficiently.
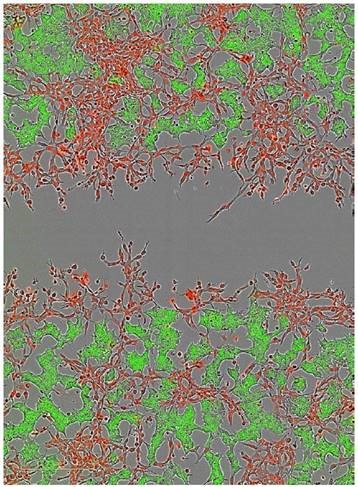
Figure 8. Two color fluorescent scratch wound. The ability to image cells in both wavelengths in addition to phase contrast now allows users the ability to explore cell-cell interactions as it pertains to cell migration and invasion. In this example, HT-1080 NucLight Red cells were plated with MCF-7 NucLight Green cells and invasion through 8mg/ml Matrigel® was monitored over time (Image shows the 24 hour time point)
Conclusion
The above data demonstrates that CellPlayer Migration and Invasion Assays, designed by Sartorius, are quantitative, flexible, and reproducible. The 96-well WoundMaker™ has a special tip design, which plays a key role in these assays.
Both assays use the integrative analysis algorithm and new HD optics of the IncuCyte® software to allow quantitative measurements without the need for cell labeling.
Such high quality images provide access to both the morphological changes and kinetics taking place in invasion and migration experiments, and help visualize the effect of test agents on cells undergoing these processes.
- Automated data acquisition – After starting the experiment, phase contrast and/or fluorescence images are collected and processed automatically.
- Direct comparison of cellular migration and invasion in an assay – Researchers can determine 3D invasion and 2D migration on the same microplate. This helps establish the specificity of drugs and the efficacy of potential drug targets.
- Label-free – The HD optics of the IncuCyte® eliminates the need for cell labeling.
- Flexible – Following an optimization step, the Invasion and Migration Assay can be used with different types of cells.
- Quantitative Metrics - Quantitative and reproducible results are obtained.
- Kinetic –The Invasion and Migration Assays, with the label-free, spatio-temporal format, enables researchers to track the extent and speed of invasion and migration for a specified set of experimental variables. This function can be employed to explore time-dependent pharmacology to improve the sensitivity of the test.
- Morphological data – At every time point, HD images are obtained and can be organized into time-lapse movies for easy viewing.
Acknowledgements
Produced from materials originally authored by Meagan Roddy, Thom Nelson, Daniel M. Appledorn and Vince Groppi from Sartorius, Ann Arbor, Michigan.
References
- Hannahan,D. and Weinberg, R. A. The hallmarks of cancer.Cell 100 (1):57 (2000)
- Friedl, P. and Wolf, K. Tumor-cell invasion and migration: Diversity and escape mechanism. Nature Reviews Cancer 3: 362 (2003)
- Liotta, L.A., Steeg, P.S. and Stetler-Stevenson, W.G. Cancer metastasis and angiogenesis: an imbalance of positive and negative regulation. Cell 64:327 (1991)
- Terranova,V.P., Hujanen, E.S., Loeb, D.M., Martin, G.R., Thornburg, L. and V Glushko, V. Use of a reconstituted basement membrane to measure cell invasiveness and select for highly invasive tumor cells. PNAS 83(2): 465 (1986)
- Fischer, K.E., Pop, A., Koh, W., Anthis, N.J., Saunders,W.B. and Davis, G.E. Tumor cell invasion of collagen matrices requires coordinate lipid agonist-induced G-protein and membrane-type matrix metalloproteinase-1-dependent signaling. Mol Cancer. 5:69 (2006)
- Brekhaman, V and Neufeld, G. A novel asymmetric 3D in-vitro assay for the study of tumor cell invasion. BMC Cancer 9:415 (2009)
- Bracke, M.E., Boterberg, T., Bruyneel, E.A. and Mareel, M.M. Collagen Invasion Assay. Metastasis Research Protocols Methods in Molecular Medicine, 58:81 (2001)
- Kovacs, M., Toth, J,, Hetnyi, C., Malnasi-Csizmadia, A and Sellers, J.R. Mechanism of action of Blebbistatin inhibition of Myosin II. J. Biol. Chem. 279(34) 35557 (2004)
- Poinclouxa,R., Collina, O., Lizárragaa F., Romaoa, M., Debraye, M., Piela, M. and Chavrier, P. Contractility of the cell rear drives invasion of breast tumor cells in 3D Matrigel. PNAS 108 (5):1943 (2011)
 Sartorius
Sartorius is a leading international pharmaceutical and laboratory equipment supplier. With our innovative products and services, we are helping our customers across the entire globe to implement their complex and quality-critical biomanufacturing and laboratory processes reliably and economically.
The Group companies are united under the roof of Sartorius AG, which is listed on the Frankfurt Stock Exchange and holds the majority stake in Sartorius Stedim Biotech S.A. Quoted on the Paris Stock Exchange, this subgroup is comprised mainly of the Bioprocess Solutions Division.
Innovative Technologies Enable Medical Progress
A growing number of medications are biopharmaceuticals. These are produced using living cells in complex, lengthy and expensive procedures. The Bioprocess Solutions Division provides the essential products and technologies to accomplish this.
In fact, Sartorius has been pioneering and setting the standards for single-use products that are currently used throughout all biopharmaceutical manufacturing processes.
Making Lab Life Easier
Lab work is complex and demanding: Despite repetitive analytical routines, lab staff must perform each step in a highly concentrated and careful way for accurate results.
The Lab Products and Services Division helps lab personnel excel because its products, such as laboratory balances, pipettes and lab consumables, minimize human error, simplify workflows and reduce physical workloads.
Sponsored Content Policy: News-Medical.net publishes articles and related content that may be derived from sources where we have existing commercial relationships, provided such content adds value to the core editorial ethos of News-Medical.Net which is to educate and inform site visitors interested in medical research, science, medical devices and treatments.