Sponsored Content by SartoriusReviewed by Maria OsipovaFeb 19 2026
Research originally authored by Kanvasri Jonnalgadda, Lam R. Markely, Scott Estes, Shashi Prajapati at High-Throughput Analytical Group (HTAG)-Cell Culture Development, Biogen IDEC, Cambridge, and MA Rashi Takkar, Sriram Kumaraswamy, Sartorius, Fremont, CA
Protein concentration measurement is a standard part of process parameter testing during product development.
High-performance liquid chromatography (HPLC) is one such measurement technique for measuring proteins in a supernatant; however, it has a low throughput and is time-consuming.
In this article, Biogen IDEC describes a Bio-Layer Interferometry (BLI)-based titer test for quantifying Fc-fusion protein in cell culture supernatants.
The assay showed good consistency, dilution linearity, and recoveries for the Fc-fusion protein. Importantly, while the data were equivalent to HPLC results, the BLI-based assay allows 96 samples to be tested simultaneously in less than 5 minutes, lowering time-to-results by more than 90 %.
Background
The cell line development group at Biogen IDEC required a reliable technique for measuring Fc-fusion protein (Protein 1) in crude cell culture supernatants.
Previously, the researchers used HPLC for protein quantification for screening and selection of potential mammalian clones at each scale-up phase, from 96-well microplates to 3 L-bioreactors.
They wanted to replace the HPLC method, which had poor throughput, complex sample preparation, and long run times, with a higher-throughput alternative that would yield accurate, reliable results.
Octet® platform solution
The Octet® QK384* instrument was chosen as an alternative to HPLC due to its numerous benefits and suitability for screening proteins in cell culture supernatant fluids. Octet® systems can evaluate crude samples, allowing users to avoid sample pre-processing.
In addition, 96 samples may be evaluated in less than 30 minutes, speeding up screening that would otherwise take more than 19 hours using HPLC.
Integrating the Octet® system with a PerkinElmer (previously Caliper Life Sciences) Sciclone robot resulted in a higher-throughput, automated screening procedure with much less analyst intervention. This article presents the results of the Biogen IDEC Fc-fusion protein test.
Assay development and results
Method
All tests were performed using an Octet® QK384* instrument connected with a PerkinElmer Sciclone robot. Greiner's 96-well black polypropylene flat-bottom microplates (part number 655209) were used to evaluate the samples.
Protein A and Protein G biosensors were chosen for their high specificity and selectivity in detecting Fc-fusion proteins in supernatants. Default settings of a 2-minute read time and 400 RPM shake speed were chosen.
Octet® assay proven robust and reliable
During assay development, standard curves were produced by diluting the purified bulk drug ingredient at concentrations ranging from 0 to 100 μg/mL in cell culture conditions. In three independent studies, assays were performed in triplicate at identical well positions.
Figures 1 and 2 show that the three combined runs had an average coefficient of variation (CV) of less than 9 % across the entire standard curve range. A dynamic range of 1-100 µg/mL yielded acceptable recovery values and CVs.
To account for any well-to-well variability, standard curves were also measured in three independent trials at various well locations (Figures 3 and 4). The assay performed similarly across all wells, indicating good uniformity across the plate.
*Octet® QK384 system has since been obsoleted and replaced with the Octet® RH16 system which can run a similar assay with even higher sensitivity.
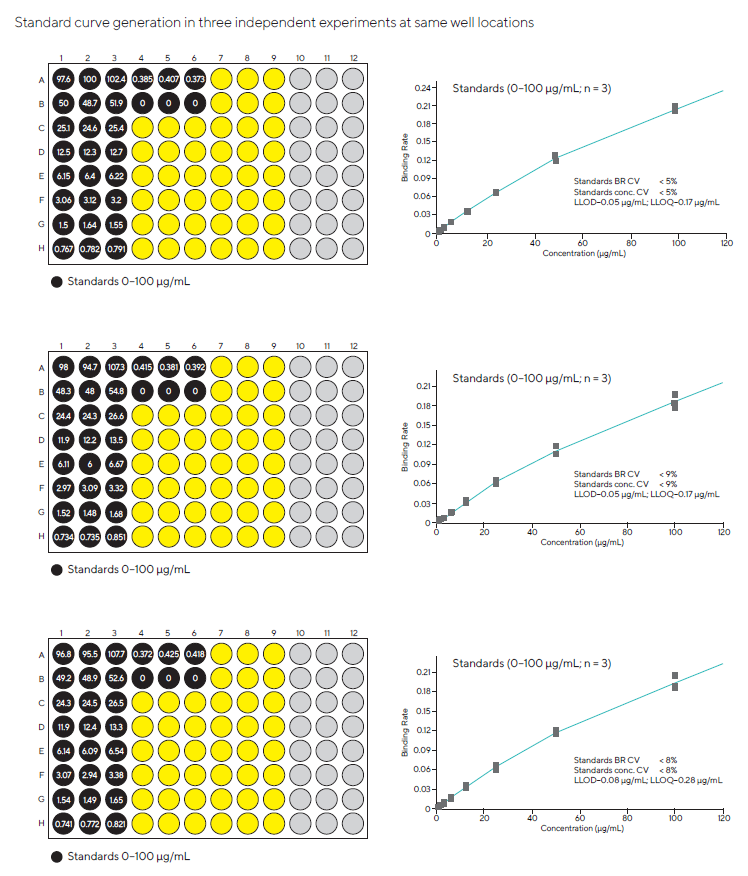
Figure 1. Standard curves of the Fc-fusion protein assay using Protein G Biosensors, obtained in three independent experiments using the same 96-well microplate well locations (BR = Binding Rate). The calculated recovery values are shown in the plate map. Image Credit: Sartorius
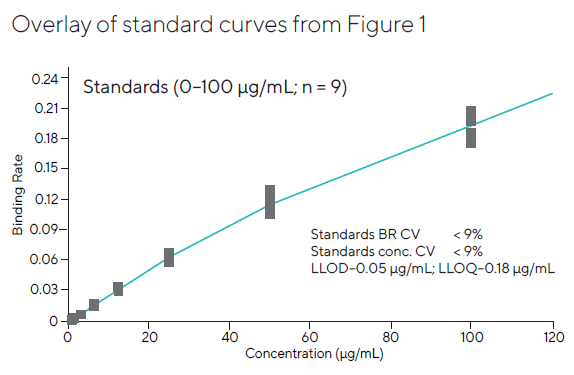
Figure 2. Pooled standard curve data generated at the same well locations in three independent experiments. The results were highly consistent across the entire plate, with CVs for all three combined runs below 10 %. Image Credit: Sartorius
Cell culture media had no effect on the results
Interference from matrix components was investigated to verify that the test could be run on all upstream process samples with minimal pre-processing. Standard samples were tested in various dilutions of cell culture media, including 8-fold (12.5 % CCM), 4-fold (25 % CCM), 2-fold dilutions (50 % CCM), and neat (100 % CCM) (Figure 5).
The four standard curves were then overlaid to determine the total variability at each concentration. The assay tolerated up to 100 % CCM, with equivalent spiking standard recoveries across all dilutions and an overall CV of < 8 %.
Results were accurate
To test the accuracy of the Octet® assay, Fc-fusion protein was spiked into CCM and HCP matrices at known concentrations in the low (10 μg/mL), mid (40 μg/mL), and high (80 μg/mL) ranges of the standard curve (Figure 6).
The spike-in recoveries for the high, mid, and low controls in neat CCM were 95 %, 104 %, and 109 %, respectively. The recoveries of all control samples in 2 (50 %), 4 (25 %), and 8 (12.5 %) fold dilutions of the HCP matrix were nearly 100 %, indicating high accuracy.
Control sample recoveries in the clean HCP matrix were approximately 122 %, which is above acceptable standards. In all subsequent experiments, the standard and unknown samples were diluted at least twofold.
To obtain accurate results, matrix interference should be minimized, and matrices used in standard and unknown samples should be consistent.
Good dilution linearity
Dilution linearity is an essential property of any assay used to screen samples with a wide range of protein concentrations. Fc-fusion protein samples at low (S1), medium (S3), and high (S2) concentrations were diluted 5-, 10-, 20-, 80-, and 160-fold, respectively, and evaluated in triplicate (Figure 7).
The CV for the back-calculated values of the low-concentration sample S1 was less than 7 %. The CV values for high concentration sample S2 and medium concentration sample S3 were below 5 %. These findings show that the Fc-fusion protein exhibits excellent dilution linearity and recoveries in cell culture supernatant.
Good correlation between Octet® data and HPLC
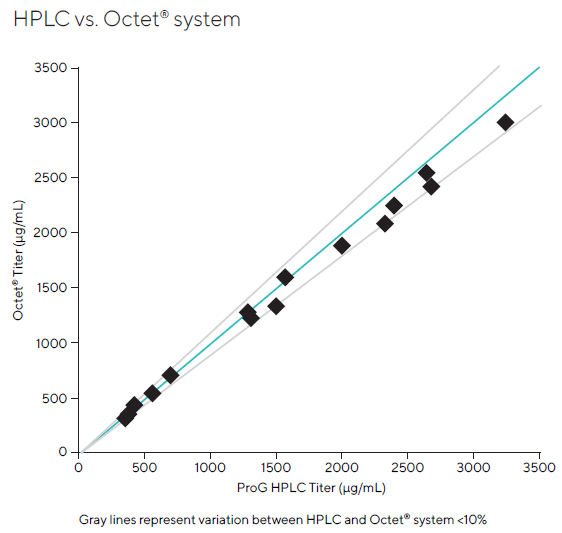
When assessing the performance of Octet® tests to supplement or replace HPLC methods, users typically conduct comparative analyses. If there are considerable changes in sample preparation and handling between the two approaches, data correlation may be compromised.
For this experiment, all materials to be evaluated on both platforms were centrifuged and filtered before analysis.
To ensure analyte concentrations were within the assay's dynamic range (below 100 µg/mL), early cell culture samples were diluted at least 2-fold in CCM, while bioreactor samples were diluted 20- to 40-fold. HPLC samples were injected undiluted at 50 μL.
The comparison study included 15 samples (Figure 8). Titer values determined by both procedures were highly comparable, falling within 12 % of one another, with the majority of samples lying within 10 %.
Analysis time for the 15 samples on the Octet® system was less than 10 minutes. HPLC analysis took approximately 180 minutes.
Octet® assay demonstrated excellent precision
The intermediate assay precision was assessed by comparing titer values of Fc-fusion protein control samples conducted on different days by separate analyzers, as shown in Figure 9. The Octet® test demonstrated outstanding precision, with an overall CV of less than 5 % across all 54 runs.
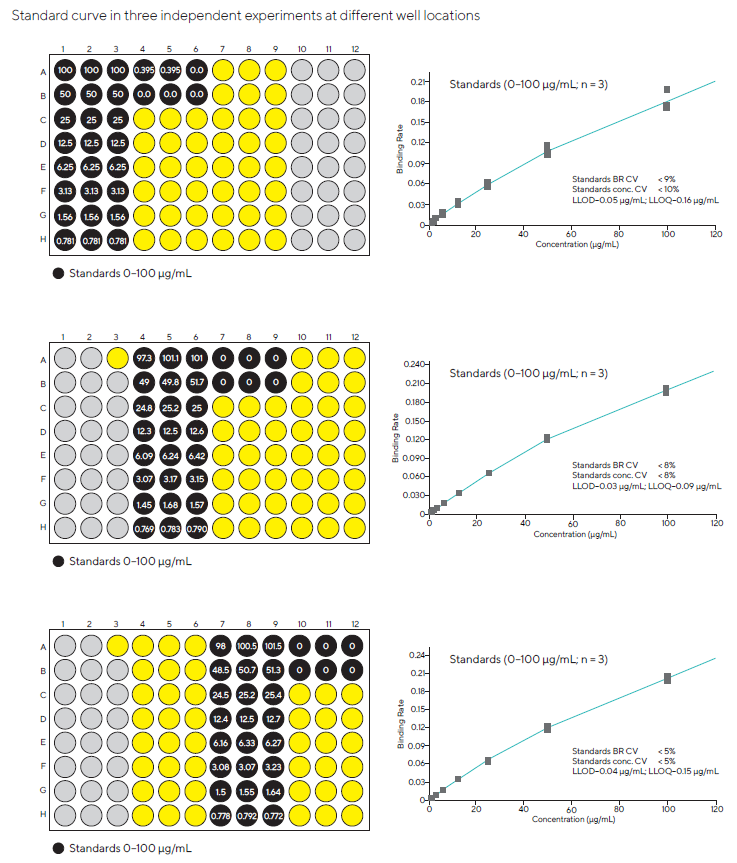
Figure 3. Standard curves were generated in different well locations in three independent experiments to check the consistency of results. Image Credit: Sartorius
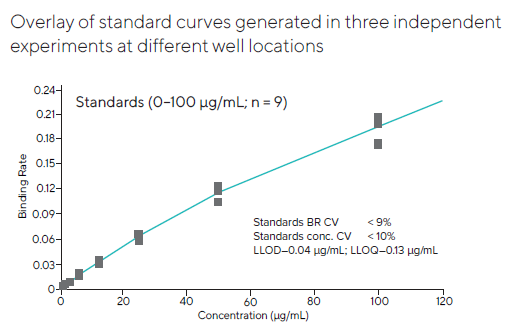
Figure 4. Pooled standard curve data were generated at different well locations in three independent experiments. The results were highly consistent across the entire plate, with a CV for all three combined runs below 10 %. Image Credit: Sartorius
To investigate media interference, a standard curve was created by diluting cell culture media at various concentrations.
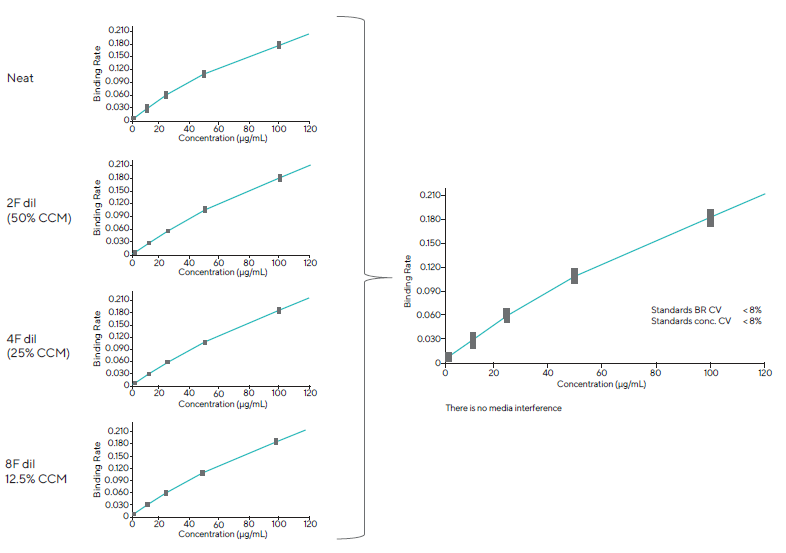
Figure 5. The assay tolerated neat (100 %) CCM. 100 %, 50 %, 25 % and 12.5 % CCM had comparable recoveries of the standard curve with an overall combined CV < 8 %. Image Credit: Sartorius
Spiking study in CCM and HCP (host cell protein media)
- Purified Protein 1 was spiked to 10, 40, and 80 µg/mL in CCM
- HCP was diluted 2F, 4F & 8F; Purified Protein 1 was spiked to 10, 40 & 80 µg/mL
- Samples were analyzed in triplicate
> CCM: Cell culture media
> HCP: Host cell protein
100 % Recovery in CCM and 22 % higher recovery in HCP neat.
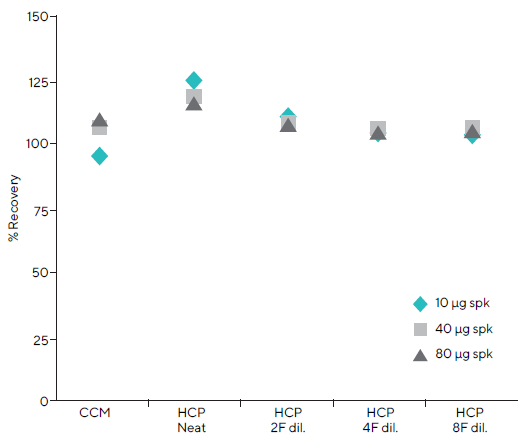
Figure 6. A Fc-fusion protein was spiked at three concentrations in the CCM and HCP matrices to assess assay accuracy. 100 % recovery was achieved in neat CCM and diluted HCP matrices; however, 122 % recovery was seen in undiluted HCP. Image Credit: Sartorius
Protein 1 sample was diluted to various folds to study the linearity of the assay.
- Three Protein 1 samples S1, S2, S3 were diluted 5F, 10F, 20F, 40F, 80F and 160F
- Samples were analyzed on the Octet® system in triplicate
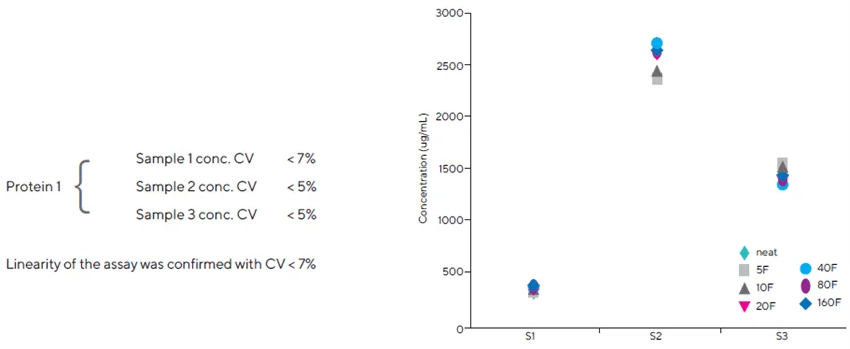
Figure 7. Dilution linearity was confirmed by diluting three concentrations of the Fc-fusion protein to various levels. Assays were performed in triplicate. Image Credit: Sartorius
Comparison study conducted between the Octet® system and HPLC for Protein 1.
| Sample ID |
ProG HPLC (μg/mL) |
Octet® system (μg/mL) |
% Difference |
| S1 |
357 |
318 |
11 % |
| S2 |
2672 |
2395 |
10 % |
| S3 |
388 |
373 |
4 % |
| S4 |
421 |
448 |
-6 % |
| S5 |
2397 |
2254 |
6 % |
| S6 |
1275 |
1266 |
1 % |
| S7 |
1299 |
1235 |
5 % |
| S8 |
1493 |
1313 |
12 % |
| S9 |
2645 |
2521 |
5 % |
| S10 |
1555 |
1578 |
-1 % |
| S11 |
2327 |
2104 |
10 % |
| S12 |
2009 |
1883 |
6 % |
| S13 |
710 |
708 |
0 % |
| S14 |
551 |
545 |
1 % |
| S15 |
3233 |
2971 |
8 % |
Figure 8. A total of 15 samples were analyzed for the comparison study. Reported concentration values showed good agreement between the two methods, falling within 12 % of each other for all samples and within 10 % for most samples. Image Credit: Sartorius
Precision of the assay was analyzed using Protein 1 across multiple days and analysts
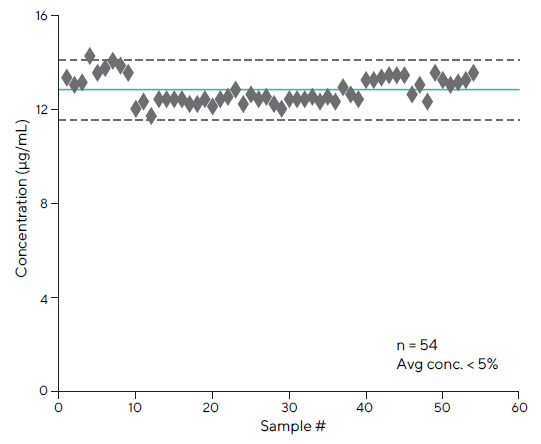
Figure 9. Intermediate precision of the Octet® assay had an average CV of < 5 % (n=54). Image Credit: Sartorius
Conclusion
Biogen IDEC developed a titer assay for Fc-fusion proteins in cell culture supernatants. The assay is now used to rapidly screen large numbers of clones and select high-producing candidates during cell line development.
Over 40,000 samples were run on the Octet® QK384* system in a single year, making it an essential tool in the company’s cell line development pipeline. The Octet® system's expanded applicability in additional bioprocess applications is currently being investigated in Biogen IDEC's cell line development lab.
*Octet® QK384 system has since been obsoleted and replaced with the Octet® RH16 system, which can run a similar assay with even higher sensitivity.
About Sartorius
Sartorius accelerates the development of breakthrough therapeutics with innovative solutions for lab filtration, cell/protein analysis, and more. Visit sartorius.com/biologics to ensure confidence in your biotherapeutic discovery and development program.
Sponsored Content Policy: News-Medical.net publishes articles and related content that may be derived from sources where we have existing commercial relationships, provided such content adds value to the core editorial ethos of News-Medical.net, which is to educate and inform site visitors interested in medical research, science, medical devices, and treatments.